|
The Strongest Windstorms in the compiled by Wolf Read |
|
Ranking windstorms for the entire Pacific Northwest coastal strip and interior is not as easy as it may seem. This is mainly because landfalling cyclones add complications to a ranking system that is based on summing peak gusts for stations throughout the region. When a low rolls ashore, stations north of the storm's track tend to be spared the strong winds that befall locations south of the centerline. Very powerful storms can do poorly in a general ranking because some stations will show very low readings. Thus, it is useful to break Northwest storms into categories based on the track that they follow. Since the separation of the eleven stations used in the general Pacific Northwest ranking system ranges from about 50 to 100 miles, this isn't too difficult to do. For example, a variety of tracks can put a low between Portland and Olympia. Despite the track differences, the results are usually similar, because the same number of stations end up south of the low's path. This is something that is easier to show, and a map depicting a range of possible paths in a particular track type accompanies each table. Wind speeds are in miles per hour for all these tables. The southern tracks are examined first, with a general progression northward. The final table puts all the storms together. The breakdown of track types is done here to provide a ready explanation for the wide range of peak gust results that are present in the single, final table. Notes: These tables aren't complete. Storms will be added as they are studied and given articles on this website. However, it's fairly certain that all the major (55.0+ 11-station average) events since 1950 are listed. The top two-to-three in each category probably won't change, unless a new, powerful storm strikes. For storms before 1965, Tatoosh Island (TTI) is used in place of Quillayute (UIL). Wind gusts in italics are extrapolated from the fastest one or two-minute wind, or fastest mile if available, using a standard 1.3 gust factor. To help orient the reader to the high wind strike zones in the tables, peak gusts of 70 mph or higher are listed in red, and peak gusts of 50 to 69 mph are listed in purple. Important: All ASOS-era storms, 1996-present. Before ASOS, the NWS recorded peak instant gusts, and with ASOS, peak 5-second wind was adopted in place of instant gusts. Peak instant gust tends to be higher than peak 5-second wind. For a fair ranking, the peak gust values for all the storms from the ASOS era are adjusted upward by 1.19. For more information behind this adjustment factor, see 'Modern' Windstorms 1995-2004: Adjusting Peak 5-Second Wind to Better Fit With Past Instant Gust Measures. Class 1: Cyclones That Track Across the Mid-Willamette Valley |
|
|
|
Cyclones that Crossed the Mid-Willamette Valley and South 1950-2004: Peak Gusts |
|||||||||||||
|
Rnk |
Event |
ACV |
OTH |
AST |
UIL |
MFR |
EUG |
SLE |
PDX |
OLM |
SEA |
BLI |
Avg |
|
1 |
46 |
63 |
39 |
12 |
43 |
83 |
37 |
37 |
19 |
25 |
25 |
39.1 |
|
|
2
|
58
|
75
|
30
|
20
|
39
|
41
|
29
|
31
|
30
|
35
|
20
|
36.8
|
|
|
3
|
48
|
56
|
37
|
29
|
49
|
42
|
38
|
25
|
25
|
33
|
15
|
36.1
|
|
|
5 |
35 |
64 |
36 |
17 |
33 |
51 |
25 |
25 |
18 |
24 |
13 |
31.0 |
|
|
6
|
31JAN1963
|
40
|
47
|
16
|
45
|
13
|
43
|
29
|
24
|
9
|
17
|
20
|
27.5
|
|
7
|
21NOV1974
|
45
|
43
|
21
|
8
|
28
|
24
|
16
|
23
|
14
|
21
|
12
|
23.2
|
|
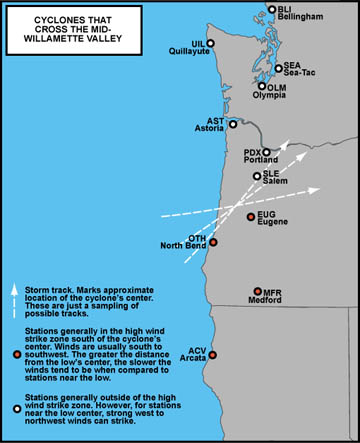
Inland storm tracks this far south are fairly rare, and this goup contains just a few significant events. Table 1, above, lists the significant, and some not-so-significant, storms of this class. Among the eleven stations, these storms tend to produce the strongest gusts at North Bend and Eugene, though sometimes Arcata and Medford will challenge the South Willamette Valley [1]. The February 7, 2002 storm was a 994 mb event that produced significant damage within a very narrow belt about 25 miles wide on a north-to-south axis in the Willamette Valley. Local areas of heavy damage, including swathing in forest stands, suggested the possibility of gusts of 80 mph or more in parts of the valley. Damage to steel power poles near Brownsville suggest gusts of at least 113 mph. This event could very well have been the "Columbus Day Storm" of its particular track class, and one equally as strong may not be seen again this century. Don't underestimate a low in the 990 mb range--a lesson I'll repeat often on this webpage. The November 9, 1975 cyclone rolled right over North Bend as a 975 mb system. This is the kind of storm that few weather forecasters would volunteer to deal with. It is arguably one of the most intense lows to land in the Pacific Northwest during the 1950-2002 time period. Not so much becuase of central pressure --a number of storms were deeper--but because this cyclone was incredibly compact. Some of the tightest gradients in history occurred with this storm, as well as some amazing pressure tendencies. Unofficial gusts hit 100 mph or more on the Southwest Oregon coast. Gusts reached 75 mph at Roseburg, highest ever for the town officially, and significantly above the peak of 62 mph during the great Columbus Day Storm. This storm tracked just south of Eugene (between Eugene and Roseburg), which spared the Willamette Valley a major hit. Nevertheless, northerly gradients became quite steep, and gusts out of the north reached gale force in parts of the valley--no small achievement. The December 16, 2002 storm moved ashore early in the morning as a 978 mb system--deep, but with broad gradients over much of the region due to already low pressures from a monster primary low in the Gulf of Alaska. The big low spun up the landfalling December 16, 2002 system. With weaker gradients than the other two events, wind speeds barely made it to gale force in the favored areas. The November 14, 1994 event was a 995 mb storm as it slowly moved inland near North Bend, with a generally eastward track. This low was unusual in that it moved in out of the west-northwest, a track that appears to have contributed to strong northwest to north winds from Coos Bay to Newport (as well as a weakening bent-back occlusion). The last two events in the table are truly marginal. The January 31, 1963 landed in the vicinity of Newport and nearly passed over Salem as a promising 984 mb cyclone. Gradients simply didn't get tight enough to produce a major gale. The November 21, 1974 storm came ashore near Gold Beach and passed over Roseburg as a broad 995 mb cyclone. This event was too far south to cause much problem in places like Eugene or North Bend, and in many ways shows remarkable similarity in surface pattern to December 16, 2002, save for the depth of the system and a more southerly track. |
|
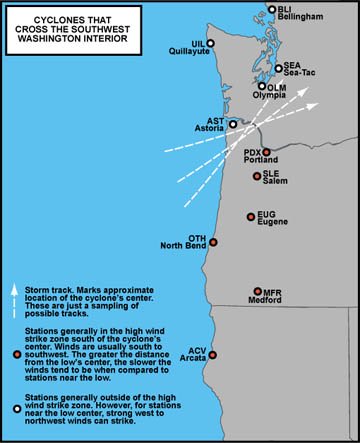
Class 2: Cyclones That Track Across the Southwest Washington Interior |
|
|
|
Cyclones that Crossed the Southwest WA Interior 1950-2004: Peak Gusts |
|||||||||||||
|
Rnk |
Event |
ACV |
OTH |
AST |
UIL |
MFR |
EUG |
SLE |
PDX |
OLM |
SEA |
BLI |
Avg |
|
1 |
50 |
72 |
45 |
60 |
72 |
70 |
52 |
74 |
24 |
48 |
32 |
54.5 |
|
|
2 |
48 |
77 |
30 |
39 |
36 |
75 |
68 |
62 |
20 |
35 |
21 |
46.8 |
|
|
3
|
10NOV1951
|
55
|
40
|
40
|
55
|
42
|
44
|
53
|
73
|
32
|
32
|
46
|
46.5
|
|
4 |
37 |
71 |
45 |
26 |
41 |
58 |
68 |
78 |
27 |
32 |
26 |
46.3 |
|
|
5
|
05FEB1965
|
35
|
52
|
47
|
43
|
39
|
49
|
58
|
68
|
35
|
38
|
21
|
44.1
|
|
6 |
10JAN1988 |
28 |
47 |
51 |
12 |
37 |
52 |
60 |
53 |
23 |
28 |
18 |
37.2 |
|
7
|
40 |
58 |
25
|
12 |
26 |
60 |
61 |
64 |
23 |
18 |
22 |
37.2 |
|
|
8
|
08JAN1990
|
36
|
39
|
48
|
23
|
26
|
45
|
49
|
63
|
28
|
25
|
25
|
37.0
|
|
9
|
26DEC1974
|
24
|
48
|
49
|
12
|
30
|
37
|
44
|
39
|
28
|
25
|
39
|
34.1
|
|
Table 2, above, lists the significant, and some not-so-significant, storms of this class. Among the eleven stations, these events tend to produce the strongest gusts at North Bend and in the Willamette Valley, though sometimes Medford will challenge the northern stations. Strong cyclones following this track class are a bit more common than the Mid-Willamette Valley crossers. A number of truly powerful events have resulted from lows moving across Northwest Oregon and into the Southwest Washington interior. The first and most powerful event in this list is somewhat distinct from the others, it having landed right over Astoria, and as a 968 mb cyclone, the deepest by far of this small collection. The storm of 1951 was one of Oregon's strongest of the 20th century. The peak gust of 72 mph at Medford is one of the highest on record for that location, and is significantly above the peak of 58 mph produced by the great Columbus Day Storm. The peak gust of 60 mph at Tatoosh Island (under UIL) was the result of powerful easterly winds whipping through the Strait of Juan de Fuca ahead of the deep low. Ranks 2, 4 and 5 all had similar paths, moving in out of the southwest and then rushing ashore between Astoria and Newport, and generated remarkably similar results. It is suspected that the January 9, 1880 "Storm King" followed this kind of path, and this name has been used to denote this particular track in various articles on this website. For the Willamette Valley, the 982 mb March 27, 1963 windstorm was second only to the Columbus Day Storm in an average of valley location peak gusts--though it was a distant second. And the 977 mb October 2, 1967 windstorm was the valley's third strongest event. The February 5, 1965 windstorm had a 993 mb center--not particularly deep, and a reminder that the 990-999 mb class of low can be potent. Wind gusts reached 81 mph at Troutdale during the 1965 event. A brief digression: It is interesting that storms 2 through 4 happened at two year intervals through the mid-1960s. There's a pattern here, and it's supported by the tracks of weaker cyclones that didn't produce gale-force winds during the same time period. This pattern set up right after the great Columbus Day Storm. Aside from the 1951 events, windstorm-generating lows following this "Storm King" path were next to nonexistent in the 1950s. Here's a thought: Major storm events sometimes (often?) happen during transitional periods. Maybe the Columbus Day Storm spun up during the transition from one climate regime to another, and that the regular arrival of Storm King-type windstorms after the Columbus Day storm marked the new regieme. Since the Columbus Day Storm does not appear to correlate with any of the known major climate cycles, like the Pacific Decadal Oscillation (PDO), this would be a heretofore unidentified climate shift, or perhaps a cycle (remember, you heard it here first!). If it is a new cycle, I propose the name CDO (the Columbus Day Oscillation--just for fun and confusion). When did the post-Columbus Day storm regieme end? Approximately 1975, it seems. In this case, the big 1976-77 PDO shift may have been the culprit. The November 10, 1951 event, number two in overall effect on the Pacific Northwest, was a secondary-spinup in progress as it landed in northwest Oregon. The secondary low had a central pressure of about 993 mb upon landfall. The peak gust for Portland is extrapolated from a maximum fastest mile of 56 mph. The January 10, 1988 storm was a much weaker cyclone--about 988 mb--that followed a similar path to the 1951 storm, if but a bit more easterly in direction. The January 8, 1990 windstorm was also about 988 mb as it landed in extreme Southwest Washington and produced a significant pressure surge across the Lower Columbia, with a +9.4 mb (+0.28") hourly jump happening at Buoy 46010. This intense storm caused significant windthrow in parts of Oregon's Coast Range. The 992 mb December 26, 1974 event was close in time to the 988 mb March 1, 1974 storm, suggesting a persistent pattern (and note the January 3, 1975 event in Class 3 below). The former wasn't as strong as the latter, and might have had a slightly more northerly path, but it still moved very close to Astoria. The December event wasn't particularly noteworthy, and is included here to provide broader perspective on what the peak gust average might indicate for this class of windstorm |
|
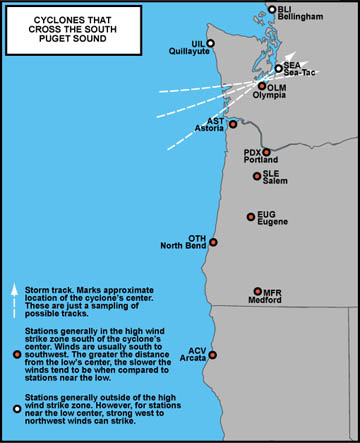
Class 3: Cyclones That Track Across the South Puget Sound |
|
|
|
Cyclones that Crossed the South Puget Sound 1950-2004: Peak Gusts |
|||||||||||||
|
Rnk |
Event |
ACV |
OTH |
AST |
UIL |
MFR |
EUG |
SLE |
PDX |
OLM |
SEA |
BLI |
Avg |
|
1 |
39 |
60 |
74 |
33 |
41 |
48 |
52 |
56 |
38 |
48 |
19 |
46.2 |
|
|
2
|
22
|
35
|
75
|
43
|
13
|
44
|
38
|
70
|
76
|
59
|
21
|
45.1
|
|
|
3
|
03JAN1975
|
29
|
58
|
58
|
21
|
22
|
54
|
49
|
35
|
39
|
38
|
21
|
38.5
|
|
4
|
07DEC1968
|
44
|
MM
|
37
|
16
|
37
|
42
|
52
|
22
|
21
|
38
|
35
|
34.4
|
|
Table 3, above, lists the significant, and some not-so-significant, storms of this class. Among the eleven stations, these events tend to produce the strongest gusts in Northwest Oregon and Southwest Washington, though sometimes places as far south as North Bend, OR, will feel the storm's wrath. Apparently, only a few significant storms have followed this path in the period of modern record. Though the 982 mb December 15, 1977 storm ranked above the 985 mb November 3, 1958 cyclone, arguably the latter was more intense. The 1958 cyclone was so compact that it was barely felt in the southern sector, while the broader 1977 storm had wider-reaching influence, which bumped up the average despite the storm haveing fewer locations with 70-mph-plus peak gusts. Incredible pressure surges accompanied the 1958 storm, with a 13.9 mb (0.41") 1-hour jump at Hoquiam (and gusts to 81 mph!), and 9.8 mb (0.29") at Olympia. The maximum burst of 76 mph at Olympia during the 1958 storm was accompanied by average winds of 60 mph, the mark of a truly powerful windstorm. An average wind of 60 mph puts incredible strain on trees, and swathing can result. Though Sea-Tac ended up north of the 1958 low's center, a northwest gale hit the station during the passage of the cyclone's bent-back occlusion, providing one of the rare cases of a north-of-the-track station showing a strong wind reading. The storm on January 3, 1975 landed near Hoquiam with a 992 mb center. This storm again demonstrates that often mentioned rule on this webpage: "Don't always judge an incoming cyclone by its central pressure!" A minimum of 992 mb isn't particularly unusual. The low plowed into strong high pressure, and very tight gradients resulted. Plus, the cyclone seems to have been in a rapid development stage, and brought with it a strong pressure surge, especially in the region of its trackline. Hoquiam had an +8.0 mb (+0.24") 1-hour pressure jump as this low swept through, with gusts to 58 mph. Olympia experienced a +5.9 mb (+0.17") 1-hour jump. These aren't record readings, but they're still quite strong. The December 7, 1968 storm moved into Western Washington as a broad 984 mb cyclone. A triple-point with strong enhancement along the storm's trailing front dragged across the Mid-Willamette Valley. Areas immediately south of the triple-point (in other words, those that ended up in the warm sector) were hammered by a strong gale--in some parts of the valley, powerful enough to take roofs off. Due to the storm's complex structure, this event produced a pattern of peak gusts similar to a Class 1 event. Hourly wind data for North Bend appear to be missing. According to the December 1968 Storm Data, unofficial gusts of 100 to 105 mph struck the coast--with this information, an estimated peak gust between 50 and 60 mph is a reasonable estimate for North Bend. |
|
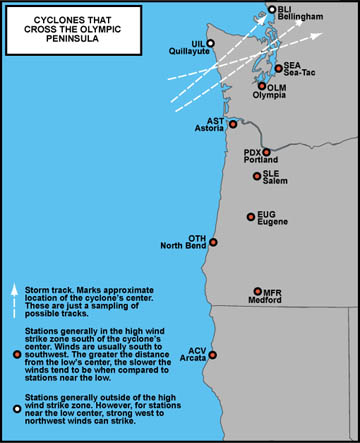
Class 4: Cyclones That Track Across the Olympic Peninsula |
|
|
|
Cyclones that Crossed the Olympic Peninsula 1950-2004: Peak Gusts |
|||||||||||||
|
Rnk |
Event |
ACV |
OTH |
AST |
UIL |
MFR |
EUG |
SLE |
PDX |
OLM |
SEA |
BLI |
Avg |
|
1 |
58 |
86 |
72 |
61 |
54 |
58 |
70 |
74 |
57 |
60 |
76 |
66.1 |
|
|
2 |
24FEB1958 |
46 |
47 |
60 |
73 |
69 |
62 |
58 |
61 |
54 |
64 |
41 |
57.7 |
|
3 |
55 |
61 |
70 |
27 |
40 |
49 |
58 |
71 |
48 |
60 |
54 |
53.9 |
|
|
4 |
52 |
64 |
72 |
32 |
43 |
41 |
51 |
43 |
55 |
64 |
59 |
52.4 |
|
|
5 |
32 |
48 |
62 |
37 |
38 |
46 |
54 |
46 |
60 |
62 |
64 |
49.9 |
|
|
6 |
38 |
73 |
70 |
38 |
36 |
46 |
44 |
46 |
48 |
62 |
26 |
47.9 |
|
|
7 |
17DEC1961 |
23 |
55 |
76 |
53 |
33 |
58 |
55 |
58 |
37 |
45 |
29 |
47.5 |
|
8 |
29 |
63 |
63 |
29 |
35 |
28 |
44 |
58 |
58 |
52 |
55 |
46.7 |
|
|
9 |
22DEC1955 |
35 |
44 |
52 |
38 |
35 |
63 |
56 |
62 |
39 |
63 |
17 |
45.8 |
|
10 |
52 |
38 |
54 |
38 |
35 |
41 |
39 |
45 |
47 |
55 |
55 |
45.4 |
|
|
11 |
21DEC1955 |
46 |
78 |
55 |
58 |
21 |
60 |
48 |
40 |
21 |
37 |
17 |
43.7 |
|
12 |
05DEC2003 |
29 |
54 |
58 |
43 |
18 |
36 |
39 |
37 |
44 |
38 |
51 |
40.6 |
|
Table 4, above, lists the significant, and some not-so-significant, storms of this class. Among the eleven stations, these events tend to produce the strongest gusts in Northwest Oregon and Most of Western Washington, though sometimes places as far south as Medford, OR and Arcata, CA, will feel the storm's wrath. The December 12, 1995 storm landed on the tip of the Olympic Peninsula with a 954 mb center, the deepest cyclone of all events considered on this web page. It could very well have been the deepest storm to strike the Northwest during the 20th century. At least seven people lost their lives during this event. This was the biggest storm of the 1950-2004 time period for the San Francisco Bay Area, with massive power outages, extremely heavy rainfall and wind gusts as high as 103 mph on Angel Island. This storm struck right on the transition to ASOS stations in the Pacific Northwest. Peak gusts are adjusted from 5-second wind for Oregon stations, save North Bend. The other stations were still utilizing the old direct-reading equipment, with peak instant gust notation. This storm is right on the margin for inclusion in Class 5. The February 24, 1958 event was a truly potent storm of this class. It appears to have landed near Hoquiam with a 978 mb center, and then tracked inland close to, but north of, Bellingham. Powerful west winds hit Tatoosh Island, and Hoquiam for that matter, in what appears to be one of Washington's strongest bent-back occlusion attacks. Bellingham escaped this assault. This event produced one of Medford's highest gusts ever (just short of the 72 mph on December 4, 1951), slammed the entire interior from Roseburg, OR, to Everett, WA, and yet generally spared the southern coast. The March 26, 1971 storm reached 978 mb and landed on the tip of the Olympic Peninsula. Winds reached particularly damaging levels along the north Oregon coast, and at Portland and Seattle. Two deaths occurred in the Seattle area. The January 20, 1993 "Inauguration Day" storm was another major event, at least for the Seattle Area. This was a 976 mb low at landfall. The strongest official gusts do not show up on this list, and include 70 mph at Boeing Field, WA, and 74 mph at Renton. In terms of property loss, this was one of the most damaging storms in the history of the Pacific Northwest. The Thanksgiving Day storm of November 1983 was a near equal to the Inauguration Day storm in peak wind distribution, and was a deeper low at 972 mb. This event can be considered an archetype for a Western Washington windstorm. The December 27, 2002 event landed near Quillayute with a 989 mb center, and its resulting gale focused on the Seattle Area as a lee low developed east of the Olympics and enhanced pressure gradients over the Puget Sound. Bellingham ended up north of the storm's track, and was spared a major gale, which resulted in a lowered ranking for this event. This is a modern-era (ASOS-era) windstorm who's intensity was somewhat "masked" by the official 5-second peak gust now recorded by the NWS--for instance, that 62 mph gust for Sea-Tac is an estimated instant gust based on the official peak 5-second gust of 52 mph. Fifty-two mph just doesn't seem as intense as 62--indeed the former does not meet official high wind criteria, while the latter does. In terms of NWS warning policy, this is a significant distinction. The December 17, 1961 cyclone rushed inland as a 975 mb system right around midnight on the 16th to 17th, and appears to have moved just north of Hoquiam and right over Everett. The December 22, 1955 cyclone appears to have moved inland between Hoquiam and Tatoosh Island, and moved right over Bellingham as a 980 mb center. Its predecessor on December 21, 1955 started weakening offshore, and rolled inland as a dying 985 mb system, which spared much of the north sector a strong gale. The December 21, 1982 storm moved just north of Hoquiam with a 983 mb center. Just a year and a month earlier, another 983 mb storm followed a similar track on November 15, 1981, on the heels of the great 958 mb cyclone of November 13-14, 1981, and added to the large mess created by its more powerful sister. The December 5, 2003 event was essentially a strong open wave that moved across Western Washington. |
|
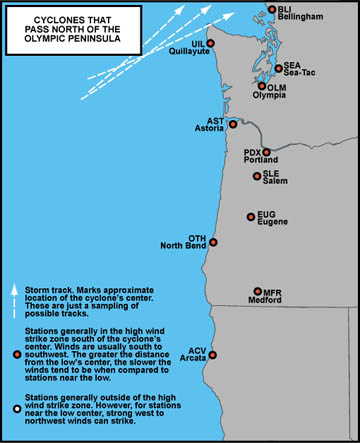
Class 5: Cyclones That Track North of the Olympic Peninsula |
|
|
|
Cyclones that Moved North of the Olympic Peninsula 1950-2004: Peak Gusts |
|||||||||||||
|
Rnk |
Event |
ACV |
OTH |
AST |
UIL |
MFR |
EUG |
SLE |
PDX |
OLM |
SEA |
BLI |
Avg |
|
NA |
80 |
23 |
46 |
60 |
70 |
80 |
|||||||
|
1 |
15JAN1951 |
60 |
62 |
80 |
71 |
45 |
60 |
52 |
54 |
59 |
75 |
60 |
61.6 |
|
2 |
48 |
58 |
79 |
65 |
45 |
62 |
55 |
61 |
56 |
71 |
75 |
61.3 |
|
|
3 |
09JAN1953 |
50 |
60 |
70 |
70 |
50 |
53 |
60 |
43 |
52 |
70 |
67 |
58.6 |
|
4 |
07JAN1953 |
43 |
60 |
66 |
73 |
55 |
58 |
55 |
49 |
35 |
56 |
56 |
55.1 |
|
5 |
19JAN1964 |
40 |
55 |
63 |
79 |
33 |
51 |
46 |
48 |
55 |
64 |
61 |
54.1 |
|
6
|
32
|
46
|
71
|
75
|
31
|
46
|
47
|
51
|
58
|
54
|
55
|
51.5
|
|
|
7 |
26 |
63 |
76 |
58 |
36 |
40 |
43 |
43 |
44 |
60 |
75 |
51.3 |
|
|
8 |
07JAN1961 |
46 |
40 |
46 |
66 |
52 |
81 |
60 |
55 |
36 |
45 |
35 |
51.1 |
|
9
|
43
|
57
|
56
|
56
|
56
|
46
|
52
|
49
|
44
|
48
|
51
|
50.7
|
|
|
10 |
51 |
69 |
58 |
60 |
31 |
43 |
54 |
45 |
48 |
48 |
49 |
50.4 |
|
|
11 |
41 |
44 |
75 |
48 |
26 |
38 |
38 |
48 |
58 |
49 |
64 |
48.1 |
|
|
12 |
20DEC1961 |
40 |
45 |
76 |
62 |
35 |
48 |
32 |
46 |
25 |
58 |
44 |
46.5 |
|
13
|
23
|
39
|
65
|
70
|
32
|
46
|
48
|
39
|
48
|
50
|
43
|
45.7
|
|
|
14
|
07JAN1990
|
23
|
35
|
62
|
41
|
35
|
58
|
61
|
54
|
38
|
31
|
55
|
44.8
|
|
15
|
11NOV1951
|
30
|
38
|
32
|
56
|
35
|
42
|
50
|
48
|
32
|
40
|
29
|
39.2
|
|
16
|
09JAN1990
|
22
|
33
|
64
|
22
|
13
|
37
|
45
|
58
|
38
|
33
|
30
|
35.9
|
|
Table 5, above, lists the significant, and some not-so-significant, storms of this class. Out of all the tables on this web page, this one is likely the most incomplete. Certainly more storms of this track class occurred in the era being considered. My main interest lies with those storms that land in Washington and Oregon, with classic storms that hug the coast on a northward track a close second, and I haven't specifically searched for northeast-to-east trending events that have landed in Vancouver Island (yet). Among the eleven stations, cyclones following this north track tend to produce the strongest gusts in Northwest Oregon and most of Western Washington, though sometimes places as far south as Arcata, CA, will feel the storm's wrath. Medford generally escapes 50-mph-plus gusts in this scenario. Of the eleven stations, Astoria, Quillayute (Tatoosh Island) and Sea-Tac are struck with high winds the most consistently. Astoria, especially, gets hammered by these events--something that forecasters might want to keep in mind. The major October 21, 1934 windstorm is included because it may have been the most powerful storm of this track type in the 20th century. Sustained winds at the Seattle Airport (Boeing Field) reached 58 mph during this event. The January 15, 1951 windstorm reached at least 978 mb intensity as it raced inland near Tatoosh Island. For the greater Seattle area, this event ranks possibly a cut above the devastating Inauguration Day Storm of 1993 in wind strength, and is second only to the Columbus Day Storm. For Oregon, this storm might have had a more lasting memory if the December 4, 1951 cyclone hadn't rampaged across the state, producing record barometric minimums and numerous instances of 70-mph-plus wind gusts. The January 15, 1951 storm produced results similar to the classic northward-trending offshore systems, and is an example of a storm without the ideal track generating some mean winds over much of the Pacific Northwest. Interestingly, in Oregon, the region just east of the Cascades received one of the strongest gales on record from this storm, with gusts to 78 mph at Redmond, and 72 mph at Klamath Falls. The March 3, 1999 windstorm bombed far off the Pacific Coast and reached 960 mb before rolling into Vancouver Island at about 980 mb. This was a major event. The intensity of this storm, like many post-1995, was somewhat hidden by the 5-second average gusts now employed by the NWS. This storm had a significant impact in Washington and on the Oregon Coast north of Coos Bay. Looks like a serious bent-back occlusion contributed to strong westerly winds on the Olympic Peninsula, including at Quillayute. This storm hampered efforts to clean up the shipwrecked New Carissa in Oregon waters. It is regarded as one of the most intense storms in recent memory. Interestingly, for Western Washington, the March 3, 1999 event may even rival the infamous Inauguration Day storm of 1993. The double strike from January 7 to 9, 1953 represents one of the most powerful one-two punches in the time period 1950 to present. During double strikes, usually one of the storms is much weaker than the other, like on October 11-12, 1962 (45.5 and 80.5) and November 13-15, 1981 (65.9 and 46.7). In the case of the 1953 storms, both ranked as 55.0+ major events. Over Northwest Washington, barometers dropped toward 975 mb as the first low thundered ashore--literally, as thunderstorms were common with this event, especially in Oregon. Thundergusts clearly contributed to peak gust strength at the southern stations. Barometers didn't fall as low during the second event. Even so, the January 9, 1953 storm produced stronger winds than the first at many locations, and generated results quite similar to the January 15, 1951 storm, making for the third quite powerful event within the span of two years. The January 19, 1964 windstorm had at least a 967 mb center as it dove across southern Vancouver Island with an almost due east track. The strong minimum central pressure classes this system among the greats since 1950. This far-reaching windstorm threw a serious gale across much of western Oregon and Washington, and represents another scenario where an event without the ideal track managed to produce results similar to the classic offshore events listed in Table 6, below. The April 27, 1962 windstorm is particularly noteworthy for its late season occurrence. April is occasionally visited by violent weather, including on the 23rd in 1943, on the 14th in 1957, and on the 5th in 1972, but neither of these events produced pressures as low as those recorded on April 27, 1962. I dare say that many locations, especially in Washington, likely saw monthly record lows on this day (though I haven't checked into this in detail). The cyclone's central pressure was at least 977 mb, perhaps a few mb lower, a depth more common in December and January, not at the end of April! Wind gusts were especially strong on the coast north of Coos Bay and in Washington's interior. Unofficial gusts of 110 mph were measured by the US Coast Guard on Oregon's Coast. The low appears to have followed an eastward track, with perhaps a slight vector northward. Finally, it may not be coincidental that this extreme late-season storm shared the same year as the early-season Columbus Day Storm--simply the presence of the latter suggests that something unique was going on during the early 1960s (1963, for instance, witnessed another late-season storm, this one at the end of March). The February 13, 1979 windstorm reached approximately 968 mb before it headed inland, and is somewhat infamous for sinking part of the Hood Canal Floating Bridge. As south winds escalated over the inland waters, a strong lee low developed east of the Olympic Mountains, which tightened pressure gradients and accelerated the airflow. This lee low is held responsible for the phenomenal winds in excess of 80 mph measured at the bridge's control tower--winds that contributed to the span's demise. The January 7, 1961 windstorm was a wierd one--it hammered Eugene and other parts of the Willamette Valley while sparing the Oregon coast a serious gale. The exact track is tentative. This event will be examined more closely at some point. The January 29, 2004 storm continued deepening as it moved inland over Southern Vancouver Island, and reached 986 mb over Southwest British Columbia. This storm threw an intense cold front into Oregon and Washington--most peak gusts are associated with this feature. The December 13, 2001 storm crossed Southern Vancouver Island as a 980 mb system. As with the January 29, 2004 storm, a strong cold front was carried inland with the low. A full squall line with extremely heavy rain moved across the greater Portland area as the boundary pushed through. The January 16, 1986 storm had at least a 990 mb center, and it moved slowly, which protracted the winds in some areas of Washington. December 20, 1961 saw a 985 mb cyclone race across Vancouver Island. Wind speeds were unusually low at the capital cities of both Oregon and Washington--perhaps the politicians weren't speaking with the usual bluster that day. The marginal November 11, 1951 storm moved across northern Vancouver Island and had a 981 mb center. And the cyclone of October 27, 1950 reached 972 mb before moving northeast across central Vancouver Island--apparently far enough away to prevent a major windstorm in the Pacific Northwest. Placement of the January 7 and 9, 1990 windstorms in this track class is preliminary, with confidence much higher for the the storm of the 7th (which happened on the 6th to 7th actually). |
|
Class 6: The Classic Cyclogenic Bombs |
|
|
|
Cyclones that Moved Northward off the Pacific Coast 1950-2004: Peak Gusts |
|||||||||||||
|
Rnk |
Event |
ACV |
OTH |
AST |
UIL |
MFR |
EUG |
SLE |
PDX |
OLM |
SEA |
BLI |
Avg |
|
1 |
58 |
81 |
96 |
78 |
58 |
86 |
90 |
104 |
78 |
58 |
98 |
80.5 |
|
|
2 |
60 |
92 |
68 |
48 |
62 |
58 |
71 |
71 |
64 |
67 |
64 |
65.9 |
|
|
3 |
56 |
61 |
79 |
54 |
46 |
46 |
71 |
70 |
64 |
62 |
79 |
62.5 |
|
|
4 |
65 |
40 |
60 |
67 |
60 |
45 |
47 |
66 |
30 |
65 |
59 |
54.9 |
|
|
5 |
29 |
40 |
43 |
69 |
46 |
52 |
48 |
69 |
48 |
52 |
47 |
49.4 |
|
|
6 |
43 |
45 |
54 |
61 |
31 |
38 |
32 |
36 |
46 |
46 |
69 |
45.5 |
|
|
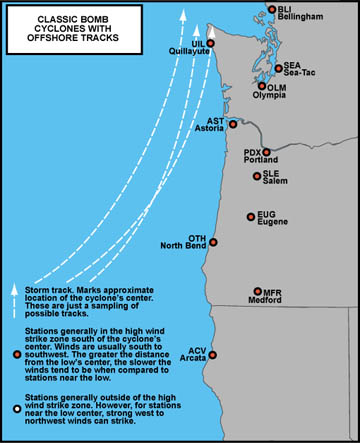
Table 6, above, lists the significant, and some not-so-significant, storms of this class. This is the ideal track for generating a high average peak gust for the eleven stations. Generally, all of these lows tracked almost due northward "inside 130," or in other words, to the east of 130 degrees west longitude. To be put in this rare category, a cyclone must cross inside 130 at a position south of 43.5 N (south of the latitude of North Bend, OR), and not cross onto land until 48.5 N (approximately the latitude of Tatoosh Island; passing over Tatoosh counts). Cyclones on these tracks end up fairly close to all eleven stations, putting the entire region at high risk for damaging winds. As a result, the table above contains some of the most notorius windstorms in the history of the Pacific Northwest. These are the "classic" events. They are also referred to as sou'westers on this website. The boundary between a storm of this type, and one that is considered to have landed in or north of the Olympic Peninsula (Classes 4 and 5, above) is somewhat fuzzy. In this case, it is the alomost due north track that defines the storms in Table 6. The major cyclone of December 12, 1995, and the much weaker December 21, 1982 storm, are right on that fuzzy line between Class 4 and Class 6. The Columbus Day storm of October 12, 1962 was hands-down the most powerful windstorm to strike the Pacific Northwest since 1950. The 14.4-point spread between the tempest of 1962 and the next strongest event on December 12, 1995 represents a significant difference--fully 14 mph would have to be added to each peak gust for the 1995 windstorm to match the Columbus Day Storm. The level of emergency caused by this event has been unsurpassed by any other sou'wester. At least 46 fatalaties were atrributed to this storm, with 23 in Oregon alone. The minimum central pressure for this cyclone was at least 958 mb (28.30") according to one ship report, though it is put at 960 mb (28.35") in the Robert Lynot Monthly Weather Review paper from 1966 (see the Columbus Day storm for detailed bibliography). Portland's peak gust is an official estimate--power failure at the onset of the storm shut down the wind instruments. Gusts on direct reading equipment at the Troutdale Airport reached 106 mph, and on the Morrison Street Bridge 116 mph, so 104 mph (converted from 90 knots) could very well be low! Some meteorologists have suggested that many of the readings during this storm were probably low due to the extreme nature of the event--many anemometers were put out of action before maximum winds had been achieved! The November 14, 1981 windstorm reached a peak intensity of 956 mb (958 mb some sources) off of the Oregon Coast. This was a major event that has generally faded from the public consciousness. For Pacific Northwest windstorms, the massive November 14, 1981 windstorm caused the second highest loss of life 1950-2004. This storm was often compared to the Columbus Day Storm in various newspapers with the articles concluding that November 1981 wasn't even close to matching the level of devastation wrought by the storm of 1962. More than suggesting that the 1981 event was weak, these articles should be taken to underscore the power of the Columbus Day Storm. The November 14, 1981 windstorm was a powerful event that caused much widespread destruction, and ended the lives of at least 12 people in California, Oregon and Washington combined. The January 16, 2000 cyclone reached about 980 mb on its northward trek inside 130. Owing to the 5-second peak gusts of ASOS, this storm at the time wouldn't have seemed powerful enough to rank number 4 on the list. It certainly wasn't as deep. The adjusted peak gust values reveal a significant storm. Few events break 60 mph for the 11-station average. The October 26, 1950 storm reached at least 969 mb as it raced northward off the Pacific Coast, putting this event in the rare sub-970 category of events. The April 14, 1957 storm was one of the latest windstorm arrivals on record, and in this case a cyclone that reached about 988 mb. The October 11, 1962 low was a precursor event to the Columbus Day Storm and it tracked near 130 deg W, which was far enough to spare the Northwest a much stronger gale. The December 21, 1982 storm reached about 982 mb. |
|
The Master List: All Storm Classes Lumped Together |
|
|
|
All Storm Classes Lumped Together 1950-2004: Peak Gusts |
||||||||||||||
|
Rnk |
Event |
Class |
ACV |
OTH |
AST |
UIL |
MFR |
EUG |
SLE |
PDX |
OLM |
SEA |
BLI |
Avg |
|
1 |
6 |
58 |
81 |
96 |
78 |
58 |
86 |
90 |
104 |
78 |
58 |
98 |
80.5 |
|
|
2 |
4 |
58 |
86 |
72 |
61 |
54 |
58 |
70 |
74 |
57 |
60 |
76 |
66.1 |
|
|
3 |
6 |
60 |
92 |
68 |
48 |
62 |
58 |
71 |
71 |
64 |
67 |
64 |
65.9 |
|
|
4
|
15JAN1951 |
5 |
60 |
62 |
80 |
71 |
45 |
60 |
52 |
68 |
59 |
75 |
60 |
62.9 |
|
5 |
6 |
56 |
61 |
79 |
54 |
46 |
46 |
71 |
70 |
64 |
62 |
79 |
62.5 |
|
|
6 |
5 |
48 |
58 |
79 |
65 |
45 |
62 |
55 |
61 |
56 |
71 |
75 |
61.3 |
|
|
7 |
09JAN1953 |
5 |
50 |
60 |
70 |
70 |
50 |
53 |
60 |
43 |
52 |
70 |
67 |
58.6 |
|
8 |
24FEB1958 |
4 |
46 |
47 |
60 |
73 |
69 |
62 |
58 |
61 |
54 |
64 |
41 |
57.7 |
|
9 |
07JAN1953 |
5 |
43 |
60 |
66 |
73 |
55 |
58 |
55 |
49 |
35 |
56 |
56 |
55.1 |
|
10 |
6 |
65 |
40 |
60 |
67 |
60 |
45 |
47 |
66 |
30 |
65 |
59 |
54.9 |
|
|
11 |
2 |
50 |
72 |
45 |
60 |
72 |
70 |
52 |
74 |
24 |
48 |
32 |
54.5 |
|
|
12 |
19JAN1964 |
5 |
40 |
55 |
63 |
79 |
33 |
51 |
46 |
48 |
55 |
64 |
61 |
54.1 |
|
13 |
4 |
55 |
61 |
70 |
27 |
40 |
49 |
58 |
71 |
48 |
60 |
54 |
53.9 |
|
|
14 |
4 |
52 |
64 |
72 |
32 |
43 |
41 |
51 |
43 |
55 |
64 |
59 |
52.4 |
|
|
15
|
5
|
32
|
46
|
71
|
75
|
31
|
46
|
47
|
51
|
58
|
54
|
55
|
51.5
|
|
|
16 |
5 |
26 |
63 |
76 |
58 |
36 |
40 |
43 |
43 |
44 |
60 |
75 |
51.3 |
|
|
17 |
07JAN1961 |
5 |
46 |
40 |
46 |
66 |
52 |
81 |
60 |
55 |
36 |
45 |
35 |
51.1 |
|
18
|
4
|
43
|
57
|
56
|
56
|
56
|
46
|
52
|
49
|
44
|
48
|
51
|
50.7
|
|
|
19 |
4 |
51 |
69 |
58 |
60 |
31 |
43 |
54 |
45 |
48 |
48 |
49 |
50.4 |
|
|
20 |
4 |
32 |
48 |
62 |
37 |
38 |
46 |
54 |
46 |
60 |
62 |
64 |
49.9 |
|
|
21 |
6 |
29 |
40 |
43 |
69 |
46 |
52 |
48 |
69 |
48 |
52 |
47 |
49.4 |
|
|
22 |
5 |
41 |
44 |
75 |
48 |
26 |
38 |
38 |
48 |
58 |
49 |
64 |
48.1 |
|
|
23 |
4 |
38 |
73 |
70 |
38 |
36 |
46 |
44 |
46 |
48 |
62 |
26 |
47.9 |
|
|
24 |
17DEC1961 |
4 |
23 |
55 |
76 |
53 |
33 |
58 |
55 |
58 |
37 |
45 |
29 |
47.5 |
|
25 |
2 |
48 |
77 |
30 |
39 |
36 |
75 |
68 |
62 |
20 |
35 |
21 |
46.8 |
|
|
26 |
4 |
29 |
63 |
63 |
29 |
35 |
28 |
44 |
58 |
58 |
52 |
55 |
46.7 |
|
|
27 |
20DEC1961 |
5 |
40 |
45 |
76 |
62 |
35 |
48 |
32 |
46 |
25 |
58 |
44 |
46.5 |
|
28
|
10NOV1951
|
2
|
55
|
40
|
40
|
55
|
42
|
44
|
53
|
73
|
32
|
32
|
46
|
46.5
|
|
29 |
2 |
37 |
71 |
45 |
26 |
41 |
58 |
68 |
78 |
27 |
32 |
26 |
46.3 |
|
|
30 |
3 |
39 |
60 |
74 |
33 |
41 |
48 |
52 |
56 |
38 |
48 |
19 |
46.2 |
|
|
31 |
22DEC1955 |
4 |
35 |
44 |
52 |
38 |
35 |
63 |
56 |
62 |
39 |
63 |
17 |
45.8 |
|
32 |
5 |
23 |
39 |
65 |
70 |
32 |
46 |
48 |
39 |
48 |
50 |
43 |
45.7 |
|
|
33 |
6 |
43 |
45 |
54 |
61 |
31 |
38 |
32 |
36 |
46 |
46 |
69 |
45.5 |
|
|
34 |
6
|
52 |
38 |
54 |
38 |
35 |
41 |
39 |
45 |
47 |
55 |
55 |
45.4 |
|
|
35 |
3 |
22 |
35 |
75 |
43 |
13 |
44 |
38 |
70 |
76 |
59 |
21 |
45.1 |
|
|
36
|
07JAN1990
|
5
|
23
|
35
|
62
|
41
|
35
|
58
|
61
|
54
|
38
|
31
|
55
|
44.8
|
|
37
|
05FEB1965
|
2
|
35
|
52
|
47
|
43
|
39
|
49
|
58
|
68
|
35
|
38
|
21
|
44.1
|
|
38 |
21DEC1955 |
4 |
46 |
78 |
55 |
58 |
21 |
60 |
48 |
40 |
21 |
37 |
17 |
43.7 |
|
39
|
11NOV1951
|
5
|
30
|
38
|
32
|
56
|
35
|
42
|
50
|
48
|
32
|
40
|
29
|
39.2
|
|
40 |
1 |
46 |
63 |
39 |
12 |
43 |
83 |
37 |
37 |
19 |
25 |
25 |
39.1 |
|
|
41
|
03JAN1975
|
3
|
29
|
58
|
58
|
21
|
22
|
54
|
49
|
35
|
39
|
38
|
21
|
38.5
|
|
42 |
10JAN1988 |
2 |
28 |
47 |
51 |
12 |
37 |
52 |
60 |
53 |
23 |
28 |
18 |
37.2 |
|
43 |
2 |
40 |
58 |
25 |
12 |
26 |
60 |
61 |
64 |
23 |
18 |
22 |
37.2 |
|
|
44
|
08JAN1990
|
2
|
36
|
39
|
48
|
23
|
26
|
45
|
49
|
63
|
28
|
25
|
25
|
37.0
|
|
45
|
1
|
58
|
75
|
30
|
20
|
39
|
41
|
29
|
31
|
30
|
35
|
17
|
36.8
|
|
|
46 |
1 |
48
|
56
|
37
|
29
|
49
|
42
|
38
|
25
|
25
|
33
|
15
|
36.1
|
|
|
47
|
09JAN1990
|
5
|
22
|
33
|
64
|
22
|
13
|
37
|
45
|
58
|
38
|
33
|
30
|
35.9
|
|
48
|
07DEC1968
|
3
|
44
|
MM
|
37
|
16
|
37
|
42
|
52
|
22
|
21
|
38
|
35
|
34.4
|
|
49
|
26DEC1974
|
2
|
24
|
48
|
49
|
12
|
30
|
37
|
44
|
39
|
28
|
25
|
39
|
34.1
|
|
50 |
1 |
35 |
64 |
36 |
17 |
33 |
51 |
25 |
25 |
18 |
24 |
13 |
31.0 |
|
|
51
|
31JAN1963
|
1
|
40
|
47
|
16
|
45
|
13
|
43
|
29
|
24
|
9
|
17
|
20
|
27.5
|
|
52
|
21NOV1974
|
1
|
45
|
43
|
21
|
8
|
28
|
24
|
16
|
23
|
14
|
21
|
12
|
23.2
|
|
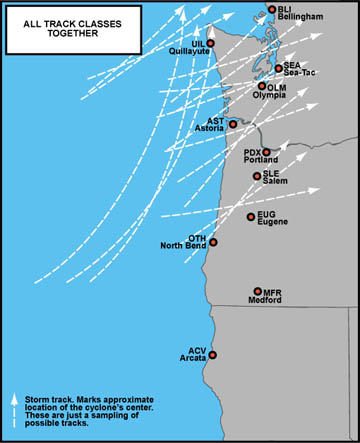
Table 7, above, lists all the storms together and ranks them by their average. This table probably contains most events with an average (rank) of 45.0 mph to 54.9, and almost certainly all events with a rank of 55.0 or higher. Without question, there have been hundreds of events that fell between 30.0 and 39.9 since 1950, and many more events 40.0 to 44.9 than shown. The low-ranking events listed either have a unique characteristic that makes them noteworthy (like a strong local gale, or an association with a stronger windstorm), or are a recent event that has been examined in detail. The justification for a list combining all the storm tracks is quite simple. The storms at the top generally affected a much broader region than the storms on the bottom, and therefore such events have a higher damage potential. Some of the events near the bottom affected small areas very strongly, but with the impact over a limited area, damage figures tend to be less than for the big storms. This broad comparison also helps single out the storm tracks that are most likely to produce a major windstorm event in the Pacific Northwest. The Columbus Day Storm wins. Events that rank above 55.0 are rare. There have been just nine such storms in the last 52 years, making for an average return period of about once every six years. There's a lot of variance with this figure. As little as two days and as much as 14 years have passed between events. Typically, these are also the "Storm of the Decade" title holders. Though, of course, some of these 55.0+ storms share the same decade, which muddies such a determination. The strongest storm for each decade goes as follows: 1951-1960: Jan 15, 1951 Class 6 storms dominate, as expected. Note that the 1970s were a relatively "calm" decade overall, as an event that ranked 53.9 was the top storm. The other four complete decades had major events highlighting them, with the 1950s having no less than 4. Note that a number of stations had higher anemometer sensor heights through much of the 1950s, including Sea-Tac, Olympia and Astoria, and thus storms from the 1950s are probably a bit favored by this ranking system. However, Olympia had some of the lower peak gusts out of any of the stations during all the 1950s events that made the top 10, so anemometer height probably doesn't mean as much as one might think. Though data is limited, making this assertion mostly a wild estimate, it appears that storms with a rank of 65.0 or higher are a 20 to 30 year event ("Storm of the Quarter-Century"). For a better determination of this, another half-century of storms would be useful. Stay tuned... Note that the top end is generally dominated by the Class 5 and Class 6 storms. Both Class 5 and 6 have four slots in the top ten. Three out of the top five are Class 6. That a Class 2 storm, December 4, 1951, made 11th place refelects on a truly powerful event. With 35 events of 45.0 or above over the 55 years 1950-2004, there's an approximate two-year return period (actually 1.6 years) for a decent windstorm that's capable of producing wind gusts of at least 58 mph (high wind warning criteria) at some, or even all, of the official stations that comprise this peak gust list. |
| The tables above depicts just one method for ranking windstorms. Peak gust is just one important measure among characteristics like maximum sustained winds, wind direction changes and wind duration. If the duration of strong winds were factored in, some of these storms would start climbing up the ladder in comparison to others--notably the November 14, 1981 event in comparison to the top three, who's attacks were of much shorter duration. Methods can be devised to factor in high wind interval, but the process of adding in duration is quite time consuming in itself! When looking at the table above, it is easy to forget how much time is required to compile something as simple as this peak gust comparison. |
|
References [1] Peak gust data for storms from the 1950 to 1995 period is from the National Climatic Data Center, unedited surface observation forms, and Local Climatological Data monthly summaries (LCD mainly for Portland during the 1950-1953 timeframe, and Feb 1958). Peak gust data for storms from the 1996-to-present era are from the University of Washington archived surface observations, save February 7, 2002 and December 27, 2002 which were from METAR reports collected online from the National Weather Service, Portland and Seattle offices. |
|
Last Modified: December 12, 2007 You can reach Wolf via e-mail by clicking here. | Back | |