The Major Windstorm of October 21, 1934

by

Wolf Read


1.0 Introduction


Figure 1.1 above Available peak gust values (mph and km/h) for areas affected by the October 21, 1934 extratropical cyclone, with some damage reports supporting the occurrence of high winds during the storm. All of these numbers are from local newspapers, save the reading for Bellingham which is from an official surface airways form, but may in fact be a 1-minute average instead of gust. An observer at Portland noted a gust to 60 mph (96 km/h) during an observation with a 41 mph (66 km/h) average wind speed. Given that the average wind climbed to 47 mph (76 km/h) during a later observation, a gust to 65 mph (105 km/h) as reported in the press appears reasonable. Values in italics are estimated gust from peak one-minute average wind using a 1.3 gust factor. Stations with high-wind criteria gusts (58 mph or 93 km/h) are denoted with white-filled circles. Isotachs depicting ≥60 mph (~100 km/h) and ≥80 mph (~130 km/h) gusts are included to highlight the regions that had concentrations of the indicated magnitudes. The estimated track of the extratropical cyclone center is shown (yellow arrow). Click on the map to see a larger version.

The great storm of October 21, 1934 had devastating impact on the Pacific Northwest, especially in Western Washington, and a little less so in Northwest Oregon. From the limited hard data available, this cyclone appears to have tracked across southern Vancouver Island in a manner similar to the February 13, 1979 storm, though probably a bit further to the south. The 1934 event appears to have produced much stronger winds than the 1979 storm--in fact, the October 1934 windstorm may be the most extreme example of a low following this particular path.

The gale of '34 appears to have been the biggest, most destructive storm to strike the Pacific Northwest in the time period delineated by the January 29, 1921 and Columbus Day 1962 windstorms. For some Puget Sound locations, such as Seattle, this was possibly the strongest storm on record. The extratropical cyclone brought high winds and widespread damage to all three of the major population centers: Portland, Seattle and Vancouver, British Columbia. Numerous buildings were damaged or destroyed. Unreinforced masonry walls and chimneys collapsed, roofs took to the air, boats sunk, countless trees toppled sometimes crushing cars and structures, fences fell, powerlines were downed and telephone service rendered inoperative (Vancouver Sun 1934a). In a manner similar to a hurricane, the combination of low pressure, strong winds and high tide produced a storm surge on the Pacific Coast that flooded many neighborhoods and towns. In some cases people were trapped by the rising water and had to be rescued during the storm. The gale was also deadly, taking a human toll that is second only to the Columbus Day Storm of 1962. At least 18 people were killed in this event, many from collapsing structures and sunken vessels.


2.0 Storm Data


For some places, especially the Oregon and Washington coast, the windstorm of October 21, 1934 might have produced wind speeds that approached those of the Columbus Day Storm 28 years in the future. Seattle, clearly, had a much stronger blow than in 1962. The problem is that there were few stations in the Pacific Northwest that were noting peak gust records at the time of the 1934 blowdown, making specific comparisons of wind speed difficult.

According to the U.S. Department of Agriculture, Weather Bureau, Climatological Data for October 1934, Oregon Section, Portland had a seemingly gentle peak wind speed of 24 mph on the 21st, but it was the highest wind for the month. For comparison, the highest wind value listed for the 1880 Storm King in the extremes section of the publication was 43 mph. It would have been nice for the WB to note what the actual wind measure was in the publication--1-min, 2-min, 5-min? The low readings suggest longer time periods than 1-min, perhaps even 15 minutes or an hour. The airways record forms for Portland, obtained from the NCDC, reveal a more dramatic story, one that fits the record of damage reported in the newspapers. The location of the station in 1934 was at the Swan Island Airport administration building, along the shores of the Willamette River (Oregonian 1934a).

A meteogram for Portland on October 21, 1934 shows some notable features (Figure 2.1). The barometric trace shows a broad sweep, with fall rates reaching 2.7 hPa (0.08" Hg) an hour, and a peak rise of 2.4 hPa (0.07" Hg). Though fairly fast, these changes are short of many strong windstorms in history. Indeed, the low of 996.3 hPa (29.42" Hg) is not that unusual for the storm season. This more relaxed pressure trend is the signature of a cyclone that landed fairly far from Portland.


Figure 2.1 above One-minute wind speed (mph), wind direction (°) and sea-level pressure (" Hg) for Portland, OR, during the passage of the October 21, 1934 extratropical cyclone.

A more important feature of the pressure minimum is that it occurred with the arrival of a front, clearly indicated by a sudden shift in wind direction out of the southwest. According to the records, moderate rain fell during the passage of this front. Winds, which averaged 10-15 mph (15-25 km/h) out of the east and southeast before the front, decreased markedly. Temperatures hardly changed, hovering around 51 to 52°F (~11°C). The barometric indicator started a slow rise after the front, and winds remained light for about an hour, with a gradual shift back to the east.

Then, in a 30 minute period, the wind suddenly jumped to 20 mph (30 km/h) along with a shift to a more southerly direction. From that point, speeds slowly climbed to a screaming average of 47 mph (76 km/h), the temperature lifted to 55°F (13°C), and the barometric pressure remained relatively flat, with a couple of minor dips. The observer recorded a gust of 60 mph at 10:30--such notations are rare from this era, and it is pure luck that it was done during this windstorm. At the time of peak winds, the observer also noted "SQALY", or squally, conditions, with the onset of moderate to heavy rains in the hour after the peak. Also after the maximum winds, the pressure rose more briskly, and the gale decreased, with a tendency toward a more southwesterly direction. The temperature briefly fell to 48°F (9°C) at 11:42 before climbing back to 55° (13°C) by 14:42.

The significance of these features becomes more apparent when conditions at Seattle are considered (Figure 2.2). There are some striking differences between the records at Seattle and Portland. The sudden onset of winds is the most eye-catching, but the behavior of the barometer is important, too.


Figure 2.2 above One-minute wind speed (mph), wind direction (°) and sea-level pressure (" Hg) for Seattle, WA, during the passage of the October 21, 1934 extratropical cyclone.


There is an initial minimum pressure of 994.2 hPa (29.36" Hg) at 06:42. After that point, winds shifted from roughly east-southeast (when they were not calm) to southwest, though they remained light. The records show light rain fell from 03:30 to 06:00. This first barometric minimum is akin to Portland's at 03:42--the front arrived at Seattle three hours after it had passed through the Rose City.

After the front moved through Seattle, the pressure elevated to 994.9 hPa (29.38" Hg) for about an hour before plunging 3.4 hPa (0.10" Hg) by 09:42. This is the beginning of a more extreme dip that would reach 989.2 hPa (29.21" Hg) by 11:42--and is an instance when the classic "double-dip" pattern showed clearly in the Seattle area during a major windstorm. More typically, it seems, the double-dip appears in places further south, like the Willamette Valley, and is the result of an extratropical cyclone's front moving through the region first, which can cause a brief dip in pressure trendlines ahead of the main drop produced by the closest passage of the low-pressure center.

A classic example of the double dip showed up in the October 2, 1967 windstorm. Using meteograms from the 1967 storm as a model, Portland and Salem look like a decent match for Seattle in 1934 in terms of a double-dip pressure curve and sudden wind attack. Seattle's barometer in 1934 did not show the extreme pressure changes experienced in the Willamette Valley in 1967. This suggests that the 1934 low tracked further from Seattle than the 1967 storm did Salem, so >50 miles (80 km) north of Seattle, most likely significantly more. Conditions at Bellingham suggest that the low tracked just to the north of that city. In fact the available record indicates that the low tracked just south of Vancouver, BC, where intense east to southeast winds preceded the incoming extratropical cyclone, contributing to a major blowdown of at least 2,500 trees in Stanley Park, followed by an abrupt shift to the west with nearly equal force (Vancouver Sun 1934b). The lowest pressure at Vancouver, 983.7 hPa (29.05" Hg) occurred from 13:00 to 15:00, and Bellingham reported 982.0 hPa (29.00" Hg) at 14:30. When wind direction changes are also considered, it is apparent that the center likely passed between these two points. This places the low around 125 miles (200 km) from Seattle at closest approach.

Aside from the pressure bump and a shift in wind direction, the leading front did little else at Seattle. Little rain. Lots of clouds.

Pressure readings from Medford to Bellingham during October 21, 1934, show the initial declension of the double dip occurring with vigor down south (Figure 2.3). Medford had a fast 4.0 hPa (0.12" Hg) pressure rise in the hour from 03:42 to 04:42--the mark of a fairly strong front. The minimum at Medford occurred one hour after low pressure at Portland. Barometer readings for Bellingham were spotty.


Figure 2.3 above Sea-level pressure (hPa) at Medford (MFR), Portland (PDX), Seattle (SEA) and Bellingham (BLI) during the October 21, 1934 windstorm. Readings at Bellingham are intermittent while at the other stations they occurred at hourly intervals.

The strong dip at Medford can be explained by a trailing front racing southeastward from the northeastward-moving low center, roughly depicted in the accompanying storm track map (Figure 2.4). Interpretation of pressure events along the west coast suggests a low bombing rapidly far off the Southwest Oregon shores, then moving northeast towards Washington [Footnote 1]. The storm reached peak intensity long before nearing land, and the frontal system raced far ahead of the mature cyclone center.

In Oregon, pressure minimums occurred along the front because the low center stayed relatively far from these locations compared to stations in Washington. Portland probably would have had a stronger secondary dip in pressure if the low had not started weakening after 04:00. The slow degradation of the cyclone as it moved toward closest approach held the sea-level pressure fairly flat, if a little unsteady, at Portland. The position of the low suggests that a strong southwest jet stream probably raced over Oregon, contributing to heavy rainfall during the storm. For Seattle, the stretching front was not as strong, and it was fairly dry. The low approached much closer to this northern city than it did Portland, and Seattle pressure readings show a marked drop post-front as the low neared--the classic double dip.


Figure 2.4 above Hypothetical storm track, with position of the leading front at 07:00 on October 21, 1934.

The extratropical cyclone center almost passed right over Tatoosh Island. This is evidenced in part by Tatoosh reporting the lowest pressure during the storm among the available stations. However, compared to places south, peak wind speeds at Tatoosh were not very impressive--one sign of a low passing to the south of the station (this meteogram is still on the to-do list). Also important is a sudden shift of wind direction from east to northeast then northwest around the time of barometric minimum, a clear signature of a track just to the south. The close association of low pressure, wind shift to the northwest and the secondary peak in wind speeds suggests that the low center passed very close to the island. Incidentally, like with the peak gust at Portland, the fact that the barometric minimum for the day was even noted was a bit of luck. It probably helped that, at 977.0 hPa (28.85" Hg), it was the lowest pressure declension for the month. Without this one data point, the pressure trace would have been almost useless for the kind of interpretation done here, as barometer readings at Tatoosh were only recorded at 12-hour intervals in the 1934 timeframe. The minimum pressure and close proximity of the extratropical cyclone center points to an approximate 975 hPa (28.79" Hg) central pressure, and places the low at the northwest tip of Washington around 13:00. This is one hour after Seattle's minimum pressure, and suggests a continued weakening of the storm as it moved inland and slightly closer to the city by the sound.

Records at Bellingham are spotty. They generally were only taken at two time periods each day: 09:15 and 14:30. On October 21st, the weather observer took some initiative during a time of extreme conditions and provided readings at 10:30 and 13:00. At 13:00, average winds out of the south-southeast had reached 60 mph (96 km/h), and "Squalls to 70" (113 km/h) were noted. The barometer read 983.4 hPa (29.04" Hg), which is markedly lower than the Seattle reading of 989.5 hPa (29.22" Hg) at 12:42. The low center had likely moved just east of Tatoosh Island within this timeframe (the 977.0 hPa minimum pressure occurred at 12:45).

Tatoosh is 126 straight-line miles (204 km) from Seattle along a bearing of about 297°, and 104 miles (168 km) from Bellingham on a bearing of ~254°, so the pressure is likely to be lower at Bellingham with a low near Tatoosh. A rather strong gradient of 6 hPa (0.18" Hg) existed fairly far from the low center. This could be the mark of the hypothesized lee-low (Reed 1980), which may have contributed some of the pressure declension at Bellingham (Figure 2.5). The tendency for troughing in the lee of the Olympic Mountains elongates landfalling low-pressure centers on an east-west axis. Given a southwest upper-air flow, the center of lee low would be northeast of the Olympics, in a good position to enhance the pressure gradient over the Puget Sound with a south to southeast pressure slope that supports strong southerly near-surface winds. Also indicated in Figure 2.5 is a very steep ~10 hPa/100 km pressure gradient south of the low, one that continued strongly to at least the latitude of Portland. This is probably an indication of a vigorous bent-back front. This intense gradient is already affecting the Seattle Area at the 13:00 time of the map. The weaker gradient shown to the north of the low is largely guesswork, though supported by being a typical feature of many landfalling lows.


Figure 2.5 above Schematic showing in very general terms the isobaric arrangement at approximately 13:00 on October 21, 1934. There may have been a discrete lee low northeast of the Olympic Mountains, indicated by the east-west elongation of the low. The limited number of barometric pressure observations prevents greater detail. The 980.3 hPa (28.95" Hg) reading for Victoria is the minimum recorded for the storm, time unknown. Only isobars near the low center (978 to 992 hPa) are shown.

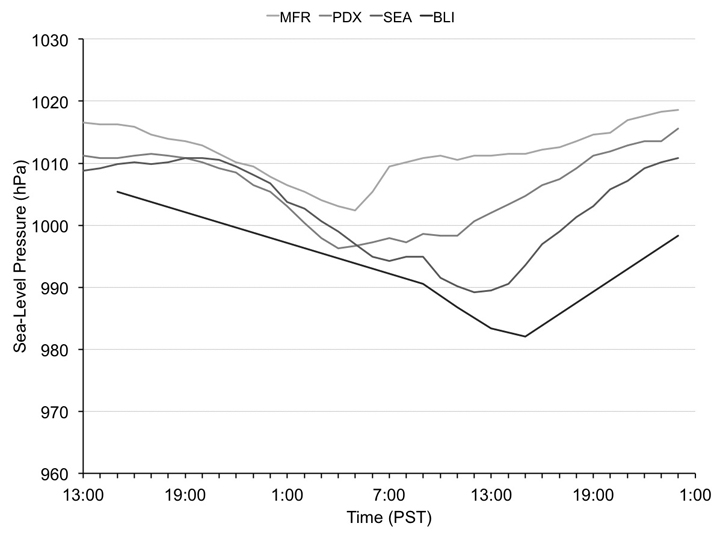
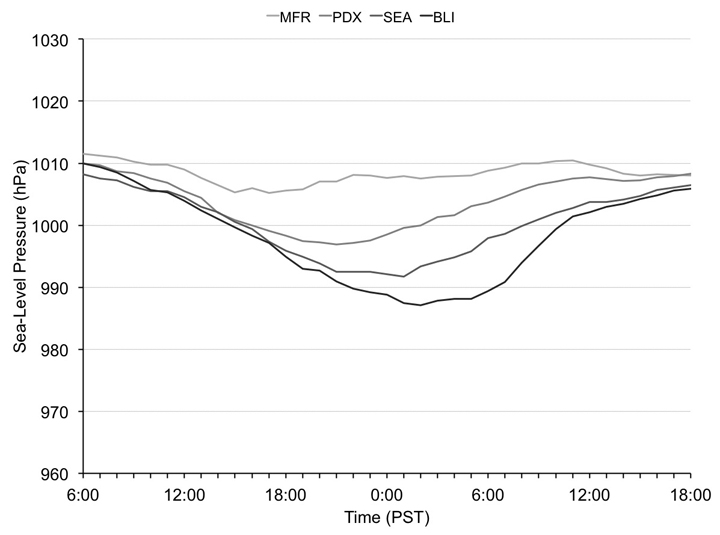
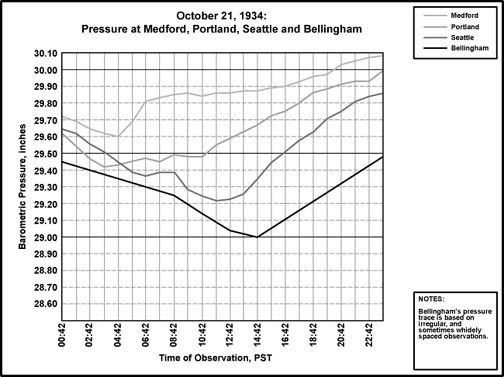
The 14:30 observation at Bellingham shows a pressure of 982.0 hPa (29.00" Hg). At the same time, the pressure at Seattle had clearly begun to climb, indicated with a reading of 993.9 hPa (29.35" Hg). This resulted in a major gradient of 11.5 hPa (0.34") between the two locations. Given the low reading at Bellingham and the slight change of pressure between 13:00 and 14:30, the center of the extratropical cyclone likely reached 
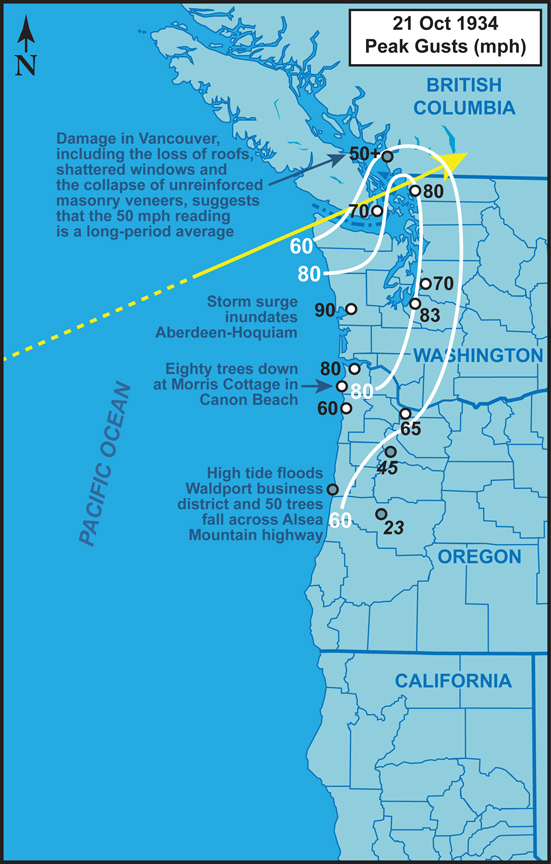
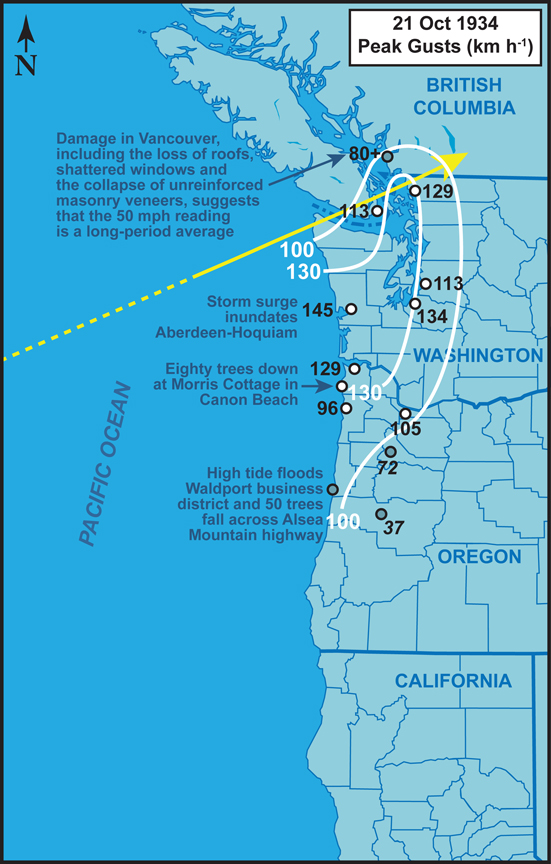
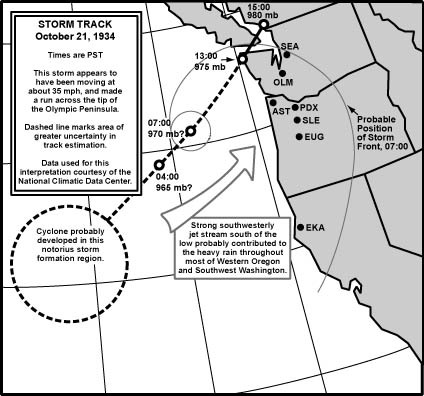
its closest point to Bellingham within the hour 14:00 to 15:00. A barograph trace from Vancouver also supports this, with the pressure beginning a sharp rise just after 15:00 (Vancouver Sun 1934c). The lowest pressure at Bellingham, 982.0 hPa, is probably close to the central pressure of the storm at the time of closest approach, suggesting that the low had weakened by about 7 hPa (0.21") as it tracked from just south of Tatoosh Island to just north of Bellingham. This is a fairly standard filling rate for landfalling storm systems in the Pacific Northwest. Even with this weakening, the low remained a potent wind producer.

By the 14:30 timeframe, average winds at Bellingham had elevated to 75 mph (120 km/h)--Category 1 hurricane speeds--out of the south-southeast, with squalls to 80, some of the most extreme readings ever recorded in the region. With these speeds, gusts may have approached 100 mph (160 km/h). The onset of high winds was fairly dramatic. Between the 09:15 and 10:30 readings, wind speeds climbed from south-southwest 3 mph (5 km/h) to south-southeast 20 (32 km/h). Over the next 90 minutes, winds climbed to the average speed of 60 mph (96 km/h) noted earlier.

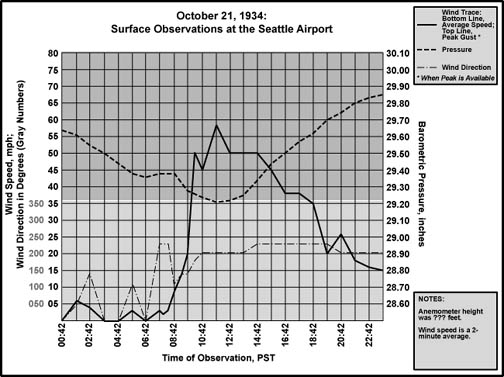
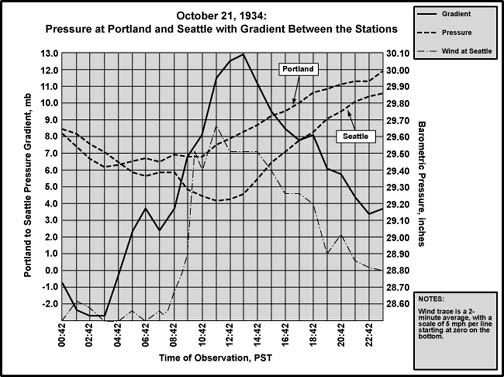
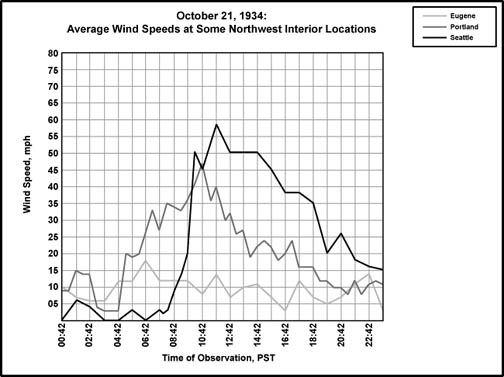
At the time the pressure started its second, more dramatic fall at the Seattle Airport, the wind speed jumped with the same drama as witnessed in Bellingham. Between 08:30 and 09:42, the average winds climbed from a mere 3 mph to 20 (5 km/h to 32), and from 09:42 to 10:10--just 28 minutes!--the wind 
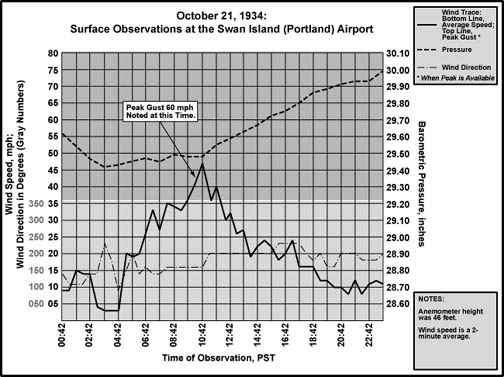
escalated to a hammering 50 mph (80 km/h). When compared to places south, like Portland, the onset of the gale at Seattle appears almost instantaneous! The duration of powerful winds at Seattle is also striking. Winds averaged 45 to 58 mph (72-93 km/h) for 6.5 hours, an incredibly long time for these high speeds. The observation forms do not have a gust record, but using the 1.3 gust factor for 
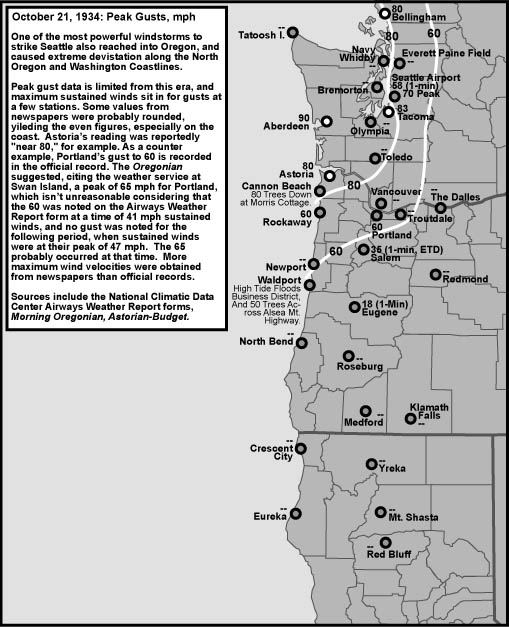
midlatitude storms, gusts of approaching and even exceeding 75 mph (120 km/h) could have occurred. Newspapers reported a value of 70 mph (Oregonian 1934a). This places the 1934 windstorm among the top most powerful on record for the Seattle area, with a higher gust than the peaks recorded during the Big Three classic-path southeasters of 1962, 1981 and 1995.

Despite the different-looking gradient curves, there is a lot of similarity between the October 21, 1934 and February 13, 1979 windstorms, especially when the lower intensity of the 1979 storm is taken into account (Figures 2.6 and 2.7). Incidentally, the 2006 Hanukkah Eve Storm, which stuck well after the first incarnation of this webpage, may in fact shared more similarity to the 1934 windstorm than the 1979 storm, plus the 2006 windstorm produced a stronger peak PDX-SEA gradient than occurred in 1934 (15.9 hPa). In any event, when looking at the 1979 extratropical cyclone, there is the already noted pressure drop between 23:00 and 01:00 for Sea-Tac from 992.5 hPa (29.31" Hg) to 991.5 hPa (29.28" Hg). Within this timeframe, a jump in the PDX-SEA gradient happens as the pressure at Portland continues to rise, and there is a corresponding sudden escalation in winds. Conditions at the Seattle Airport in 1934 were quite similar, with a sudden escalation in gradient and wind as the pressure dips downward at Seattle. The magnitude of events is much greater. Considering the less extreme conditions during the 1979 storm--such as higher overall pressures and lower gradients--it seems a reasonable conclusion that the small dip in 1979 is an analog of the major dip in 1934. However, light rain, and a brief wind shift from east-southeast to south-southwest in the time period of the flat pressures at Sea-Tac suggest that the primary controller of the minimum pressure during the 1979 storm was a frontal system arriving approximately at the same time as the closest passage of the low-pressure center. The front may have contributed to a shift in pressure-gradient orientation (pressure slope) from easterly to southeasterly, supporting the abrupt onset of southerly winds at Seattle.


Figures 2.6 and 2.7 above Sea-level pressure (" Hg) for Seattle and Portland, Portland-Seattle pressure gradient (hPa [mb]) and wind speed at Seattle (same scale as in Figure 2.2) for the October 21, 1934 (top) and February 13, 1979 (bottom) windstorms.

At the Seattle Airport in 1934, the temperature jumped from cool 49°F (9°C) at 08:30 to a mild 62°F (17°C) at 10:42, with most of the climb happening during the onset of gale-force winds out of the south and south-southwest. The sudden warmth suggests that a warm sector had been emplaced well inland to the southwest of the low center, one that did not show up in Portland as strongly, which is somewhat unusual. Perhaps the cold surface layer emplaced during the offshore wind phase ahead of the low was scoured out by an occluded front, mimicking a warm front. Downdrafts may have contributed to the warming, and perhaps also peak wind speeds by bringing down some upper-wind momentum. Lower temperatures at Portland appear to have been the result of rain throughout the morning and afternoon, whereas Seattle generally escaped precipitation. Seattle seemed determined to support the dry windstorm mythos, and continued the rainless trend throughout the period of strong winds, which contrasts sharply against the squally, heavy-rain conditions seen at Portland. At the most, sprinkles fell on the Seattle area from a heavy overcast between 12:42 and 15:30 while the winds raged. The high temperature happened during a period of broken clouds at 2,000 feet (600 m) with eight-tenths cover--the still fairly strong October sun may have helped warm the air.

The peak PDX-SEA pressure gradient, 12.9 mb, though not the strongest, puts this storm in the number three spot. Only the November 3, 1958 and December 15, 2006 windstorms produced a higher gradient, 13.6 hPa and 15.9 hPa respectively. The 1958 system had an advantage, since it nearly went right over the Seattle-Tacoma Airport, which put the area of steepest gradient near the low center right in line with the PDX-SEA measure. This happened again on December 15, 1977, when a storm produced a 12.3 mb gradient between Portland and Seattle, which is also among the steepest on record. The peak gradient of the 2006 extratropical cyclone, following a track similar to the 1934 tempest, reflects a truly remarkable storm. It should be kept in mind that the station locations in 1934 were different from those in the 1958-2006 timeframe, though the minor change in overall distance would only result in slight modifications in the gradient measure.

That the 1934 low tracked through southwest British Columbia and produced a PDX-SEA gradient that is equivalent to storms that have moved right over the Puget Sound marks a very potent extratropical cyclone. Not even the February 13, 1979 storm, on its similar path, produced such a steep gradient--it managed 7.9 mb, which is below many of the windstorms on record, but fits with a low tracking fairly far north of Seattle.

A plot of the pressures from the 1979 storm for the same stations depicted in Figure 2.3 shows broader, gentler curves at the Washington stations (Figure 2.8). The strong frontal system in Oregon in 1934 also jumps out. The magnitude of difference between the storms becomes very clear when the period of maximum relative pressure differentials are compared: values approached an intense 30 hPa (0.90" Hg) between Medford and Bellingham in 1934, compared to a strong 20 hPa (0.60" Hg) in 1979. The lower gradients in 1979 appear to be, in part, the result of a cyclone that tracked further north than its much earlier predecessor.


Figure 2.8 above Sea-level pressures (hPa) at Medford (MFR), Portland (PDX), Seattle (SEA) and Bellingham (BLI) for the February 13, 1979 windstorm. Times start on February 12th.

The 1934 extratropical cyclone, despite slowly weakening over time, maintained an incredibly steep pressure differential across Washington and into Oregon. At approximately 13:00, with the storm center near Tatoosh Island, the gradient was 18.6 hPa between Portland and Bellingham. When the center of the Columbus Day Storm sat in a similar position at 22:00 on October 12, 1962, the gradient was 14.3 hPa between the two stations. Peak PDX-BLI gradients were 22.7 in 1934 and 17.7 in 1962. Clearly, the 1934 storm ranks with the strongest in recorded history.

Weather records on October 21, 1934 at Salem and Eugene were obtained, but surface observations for other locations such as Olympia and Astoria were not available. And there was no pressure data taken for Salem and Eugene in 1934. The available information shows that peak winds decreased markedly southward in the Willamette Valley (Figure 2.9). At Salem wind speeds were estimated from 08:42 to 11:42, possibly due to a power outage that shut down the anemometer. Of course, this was the time period of peak winds. The highest speeds were estimated at 35 mph (56 km/h) for Salem, which suggests gusts around 45 mph (72 km/h), maybe reaching 50 (80 km/h). Periods of moderate rain moved through the capital during the gale. Eugene had a fairly tranquil day, with a peak wind of 18 mph (29 km/h), though moderate to heavy rain struck both in the early morning and late night, with a generally cloudy day between.


Figure 2.9 above Wind speed (mph) for Eugene (light gray), Portland (dark gray) and Seattle (black) during the October 21, 1934 windstorm.

Lower peak winds southward nicely supports the idea that the 1934 low had a strong easterly component to its track. If it were a northward-trending system, then maximum winds would have been more uniform north to south. The February 13, 1979 storm produced similar results, though peak gusts tended to be fairly uniform from about Olympia south to Eugene, where gusts reached 40-44 mph (65-70 km/h) at many interior reporting stations, which is a reminder that each storms are unique, even when they appear to have followed similar paths.

The highest winds appear to have struck Oregon stations one to a few hours sooner than Seattle, suggesting that there was, as noted above, some northward motion involved with the depression. The path was probably east-northeast. The strongest winds at Seaside were apparently between 07:00 and 10:00 (Oregonian 1934b). This is about an hour ahead of the timing of strong winds at Portland, and nearly three hours ahead of Seattle. Portland's peak wind of 47 mph (76 km/h) happened about one hour ahead of Seattle's 58 mph (93 km/h). This was during the period of rapid pressure fall witnessed at Seattle. The onset of winds in a narrow range of time is another mark of a cyclone traveling more east than north.

As noted, the storm was generous with rainfall in Oregon, dropping 0.93" (23.6 mm) on Portland in 24-hours on October 21st, 1.40" (35.6 mm) on Salem, and 1.39" (35.3 mm) on Eugene. The week of the 19th to 25th was rainy in general, with totals of 4.26" (108.2 mm) at Portland, 3.35" (85.1 mm) at Salem, and 3.44" at Eugene (87.4 mm), totals close to monthly normals.


3.0 Storm Anecdotes


A Journal Entry from Winlock, Washington

Josh Berelson kindly provided a short journal entry from his wife's Great-Grandmother (Figure 3.1), who lived in Winlock, Washington at the time. Apparently she only made brief notes on the weather and the amount of words describing the storm is unusual. She also captured a number of other windstorms of note in her journals, including the 1962 Columbus Day Storm.


She wrote:

"Oct 21 [1934]: Windy and rainy all day. Lots of trees fell and some twisted off. Old buildings fell and wires broke. I rode to Napavine on the train. Dad met me with Alice's rain coast. I didn't get very wet."


Footnotes


1) For a low moving northward (i.e. classic windstorms), stations north of the low center would experience pressure drops while those south simultaneously showed rises. Eastward trending lows (i.e. "west-jet" systems) making landfall tend to result in minimum pressure occurring at nearly equal times among stations along a north-south axis, with the lowest readings near the low-center track.


Data Sources and Bibliography


Data Sources

Unless stated otherwise, information reported in the Storm Data section is from the unedited "Airways Weather Report" forms (akin to the Unedited Surface Observation Forms of later years), acquired from the National Climatic Data Center, for Seattle, Portland, Salem and Eugene, October 21, 1934.

Peer-Reviewed References

Reed, R. J., 1980: Destructive winds caused by an orographically induced mesoscale cyclone. Bull. Amer. Meteor. Soc., 61, 1346-1355.

Other References

Oregonian, 1934a: Morning Oregonian, October 22, 1934.

Oregonian, 1934b: Home at beach wrecked. October 22, 1934, p 12.

Vancouver Sun, 1934a: Widespread loss in terrific Vancouver Gale. October 22, 1934, p 1, 3.

Vancouver Sun, 1934b: Park damage: Trees uprooted, paths blocked, shell escapes. October 22, 1934, p 1, 5.

Vancouver Sun, 1934c: How science read riddle of storm. October 23, 1934, p 1.


Figure Archives


In the case of a difference in values between the archived figure and its new replacement, the data in the new figure supersedes the numbers in the older image.


Last Modified: November 30, 2015
Page Created: November 27, 2002

| Back |