|
The Strong Windstorm of March 2 - 3, 1999 compiled by Wolf Read |
|
|
|
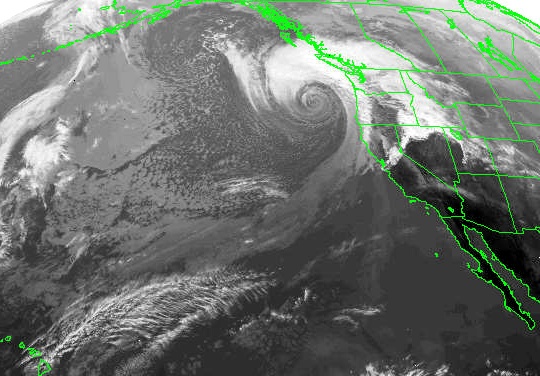
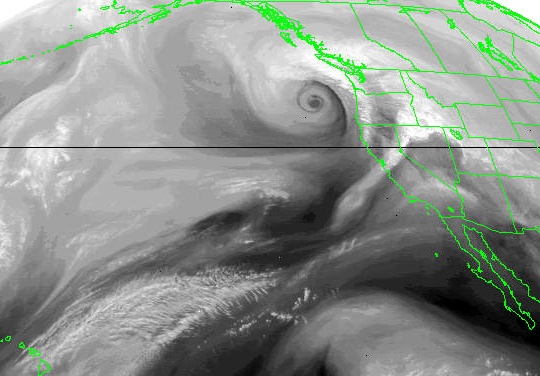
An intense, mature, 960 mb cyclone moved northeast-ward off the Pacific Coast and into southern Vancouver Island as it degraded to 978 mb, and kicked up the most intense region-wide windstorm since the monster December 12, 1995 cyclone. The 1999 cyclone had enough of an easterly component to its track that it doesn't quite fit into the "classic sou'wester" category. Nevertheless, it affected a broad area of the Pacific Northwest with damaging winds. Drawing from storms of history, a close analog to this event might be the February 13, 1979 gale, though the 1999 storm had a stronger reach into Oregon's interior. A very protracted period of fast winds on the Washington coast was a characteristic of both storms, as were escalating wind speeds from Olympia to Sea-Tac, a sign that an Olympic lee-low probably developed during the March 1999 storm, though it seems to have been less pronounced than in the 1979 event. The Highway 101 bridge across the Columbia from Astoria was shut down for five hours, due to a blown-over truck. The Evergreen Point Floating Bridge in Seattle was also shut down for many hours. Treefalls and broken powerlines were widespread throughout much of western Oregon and Washington. Due to the storms large size, slow movement and long duration, some incredible seas were kicked up. According to the National Climatic Data Center's Storm Data, March 1999, buoy 46050, Stonewall Banks, off of Newport, OR, recorded 46-foot swells, and Buoy 46029, Columbia River Bar, noted 42-foot swells. Low-lying coastal roads were inundated by the heavy surf in Oregon and Washington. Downtown Raymond was flooded. Logs were thrown across roads, and through first-floor windows and doors at some residences and hotels along the shore. The front end of the broken New Carissa, which went aground in a storm on February 4th, was being towed out to sea to be sunk in deep water on March 2nd. Due to the strain of the heavy sea, the line parted and the bow floated back to Waldport. Figures 1 and 2, below, are an infrared satellite photo, top, and a water vapor satellite photo, bottom, of the March 2-3, 1999 cyclone, taken around midnight on the transition from March 2nd to 3rd. The form of this storm is stunning, with a symmetrical closed spiral indicating a mature low with a sub-980 mb center. Not every Northwest storm takes on such a picture-perfect appearance. Of note is the fairly distant position of the storm's center, at about 130 W while at the latitude of about 45 N. Strong winds were buffeting the Oregon coast and interior at the time of the photos, but owing to the distant location of the low, the winds weren't as strong as they could have been. The low got much closer to the coast when it had reached the latitude of Washington, and stronger winds hammered the interior sections of the Evergreen State. Satellite images on this web page courtesy of the National Climatic Data Center's Historical GOES Browse Server, and modified for this presentation. |
|
|
| I lived in Lafayette, CA, when the March 2-3, 1999 storm attacked the coast. This event wasn't particularly strong at my home, but still resulted in some notes: |
|
|
|
|
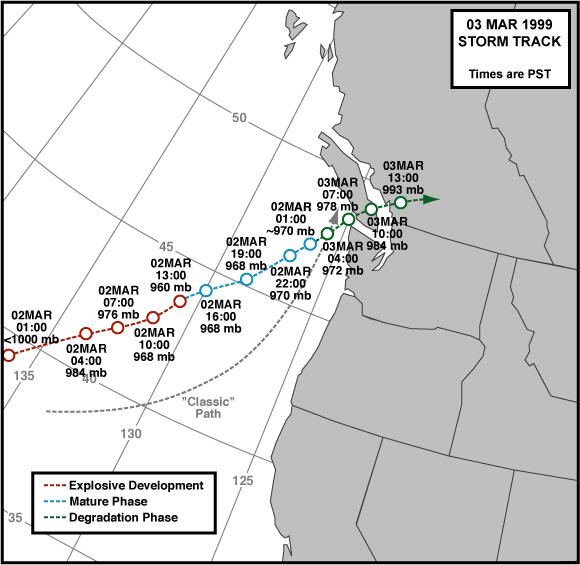
March 3, 1999: Meteorological Details The storm track for the March 2-3, 1999 storm is shown in Figure 5, below. The storm's explosive development phase occurred far offshore, an eventuality that likely spared the Pacific Northwest a truly punishing gale. The minimum 960 mb (28.35") reading was provided by a ship report. By the time the cyclone had crossed 130 W, it had entered the mature phase; still a potent storm with a central pressure of 968 mb (28.58"), but not as energetic as previously. By the time the storm neared the Washington coast, it had started to degrade. The low filled rather quickly after that point, another happenstance that likely weakened the storm's effects, especially for Washington. This storm was also a slow mover, which protracted the high winds in some areas, but was also a mark against fast wind speeds. Even with these variables against the storm, it still had quite a wallop, especially for the area north of a Newport to Eugene line. A classic sou'wester path is included on the map to show the difference in tracks. Sources: Data from NOAA/NWS NCEP surface maps. |
|
|
|
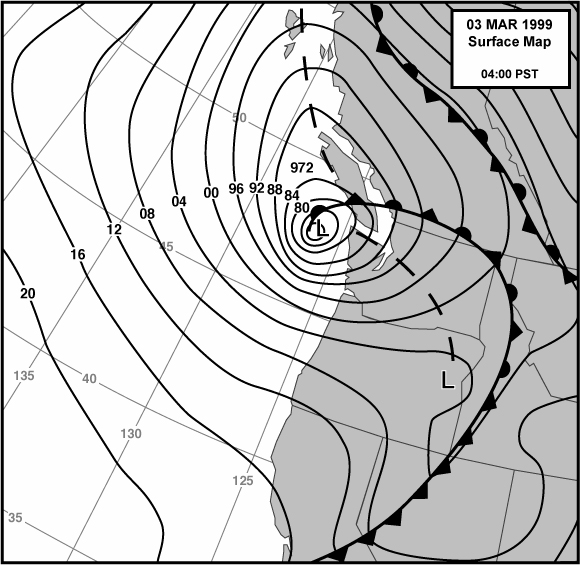
A 04:00 PST surface map for the March 2-3, 1999 storm is shown in Figure 6, below. Tightly packed isobars stretch from about Newport, OR, all the way up Washington's Pacific Coast, and inland. High winds affected much of the region at this time. Sources: Data from NOAA/NWS NCEP surface maps. |
|
|
|
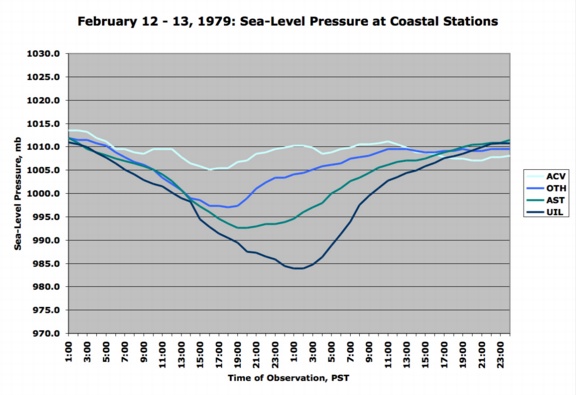
General Storm Data Table 1, below, lists the barometric minimums for the March 2-3, 1999 storm at selected sites. Though these values are quite low, especially in Oregon, a number of Pacific Northwest windstorms have produced significantly lower readings. In terms of distribution and magnitude, these pressures are quite similar to the February 13, 1979 windstorm. They're a bit deeper in general, but not too far off the mark. These two storms share a number of similarities. Sources: National Climatic Data Center, unedited local climatological data hourly tables. |
Table 1 Notes: [1] Last of two occurrences in a row. [2] Last of three occurrences in a row. |
 |
 |
|
Table 2, below, lists the maximum gradients for some standard measures during the March 3, 1999 cyclone. This cyclone had an excellent showing over much of the region, with very strong gradients, especially on the coast, and over the Western Washington interior. The long measure, ACV-UIL, had an incredible +35.7 mb (+1.05") gradient at 03:00 PST. This value, and those below, are near the range of the Big Three, October 12, 1962, November 13-14, 1981 and December 12, 1995. And the important Washington Interior measure, PDX-BLI showed +18.4 mb (+0.54") at 09:00, putting this storm in the top five for the period 1948-2003. Where the March 2-3, 1999 cyclone didn't do so spectacularly is in the Oregon Interior. The maximum MFR-EUG and EUG-PDX values, though fairly strong, aren't quite at the +9.0 mb (+0.27") or greater levels typical of the big windstorms. Sources: National Climatic Data Center, unedited local climatological data hourly tables. |
Table 2 Notes: [1] Last of two hourly occurrences, the other having happened the hour before. [2] SLP data missing for DLS from 23:00 to 05:00 both days. |
|
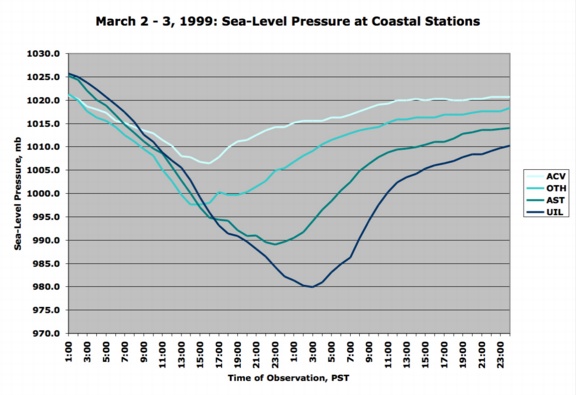
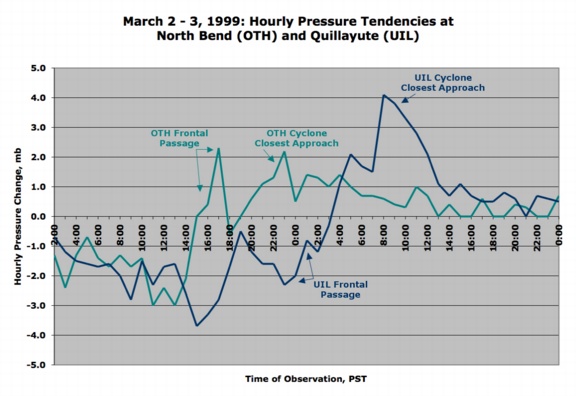
Pressure Tendencies There's a remarkable uniformity in the timing of peak pressure falls across the Pacific Northwest, which approximately coincides with the point that the March 2-3, 1999 cyclone reached its lowest central pressure. The late timing of peak pressure rises at Seattle and Bellingham may have something to do with the development of an Olympic lee low as the cyclone moved across southern Vancouver Island and filled. Though none of these readings are records, overall, the storm brought a fairly decent pressure couplet to the entire region, reflecting the potential for high winds at any location. Sources: National Climatic Data Center, unedited local climatological data hourly tables. |
Table 4 Notes: [1] The +2.4 mb hourly rise is the last of two hourly occurences, the other having happened the hour before. [2] The -2.9 mb fall is the last of two hourly occurrences, the other having happened at 12:00 HRS. [3] The -3.2 mb hourly fall is the last of three hourly occurrences, the others having happened at 13:00 and 14:00. [4] The -3.4 mb hourly fall is the last of two hourly occurrences, the other having happened at 14:00. |
||||||||||||||||||||||||||||||||||||||||||||||||||||||||||||||||||||||||||||||||||||||||||
 |
|
Table 5, below, lists the peak wind and gust for eleven key stations in the Pacific Northwest, their direction, and their time of occurrence. "Peak Wind" is a 2-minute average, and "Peak Gust" is a 5-second average. By my own personal methodology, a wind event rates the term "windstorm" when the average peak gust of these eleven stations reaches 39.0 mph (gale force) or higher. The March 2-3, 1999 windstorm easily made the cut, and is solidly in the moderate windstorm category. Moderate windstorms have an average of 45.0 to 54.9, and major windstorms are those that reach or exceed 55.0. Only a handful of storms have made the majors, including October 12, 1962, November 13-14, 1981 and December 12, 1995. Note that the newer 5-second gust adopted by the NWS alters the meaning of the kind of storm ranking system I describe here, for the ranking system was originally developed for pre-ASOS windstorms, 1948-1995. See "Adjustments to Modern Storms." Using the 1.19 factor described in the Adjustments page, the March 2-3, 1999 windstorm ranks a 61.3, which puts it in the category of major windstorms. The minimum central pressure of 960 mb also supports this assertion. This event wasn't quite at the 65.0+ level of the 1962, 1981 and 1995 windstorms, but it clearly had significant punch. The Willamette Valley stations all had double wind escalations during the March 2-3, 1999 windstorm, the first one in association with the passage of the front in the late afternoon and evening on the 2nd, and the second one happened right around midnight when peak gradients developed as the cyclone moved to the north. In some cases, such as at Eugene, the frontal winds were stronger, or as strong, as the later surge. The most powerful winstorms in the Willamette Valley seem to occur when the storm's leading front arrives at about the time the cyclone reaches a position for an optimal south-north gradient. A strong, dynamic frontal boundary can mix down fast mid- and upper-level winds, which then sweep into already speedy winds along the valley floor due to a good gradient. The most notable example of the front and cyclone arriving in near-perfect phase in the Willamette Valley is the great Columbus Day storm of 1962. The results can be devastating. The frontal system of the March 2-3, 1999 arrived many hours out of phase, and this was one more contributing factor, among those described in the introduction, that spared the valley a more destructive gale. Sources: National Climatic Data Center, Unedited Local Climatological Data. Some of the times listed in the table below are approximate. |
| Location |
Peak |
Direction |
Obs Time of |
Peak |
Direction |
Obs Time of |
| California: | ||||||
| Arcata |
28 |
140 |
14:52 HRS, 2nd |
40 |
140 |
14:52 HRS, 2nd |
| Oregon: | ||||||
| North Bend |
36 |
230 |
01:50 HRS, 3rd |
48 |
230 |
01:50 HRS, 3rd |
| Astoria |
47 |
180 |
23:56 HRS, 2nd |
66 |
180 |
23:56 HRS, 2nd |
| Medford |
32 |
130 |
13:56 HRS, 2nd |
39 |
130 |
13:56 HRS, 2nd |
| Eugene |
37 |
220 |
17:35 HRS, 2nd |
52 |
170 |
23:56 HRS, 2nd |
| Salem |
36 |
190 |
00:56 HRS, 3rd |
46 |
190 |
00:56 HRS, 3rd |
| Portland |
43 |
210 |
23:56 HRS, 2nd |
51 |
200 |
23:56 HRS, 2nd |
| Washington: | ||||||
| Quillayute |
38 |
230 |
06:53 HRS, 3rd |
55 |
220 |
06:53 HRS, 3rd |
| Olympia |
38 |
170 |
02:56 HRS, 3rd |
47 |
150 |
02:56 HRS, 3rd |
| Sea-Tac |
44 |
190 |
04:56 HRS, 3rd |
60 |
180 |
04:56 HRS, 3rd |
| Bellingham |
51 |
150 |
09:53 HRS, 3rd |
63 |
150 |
09:53 HRS, 3rd |
| AVERAGE |
39.1 |
185 |
51.5 |
176 |
|
Last Modified: February 4, 2006 You can reach Wolf via e-mail by clicking here. | Back | |