The Windstorms of 1995-2006:
Adjusting Peak 5-Second Wind
to Better Fit With Past Instant Gust Measures

compiled by

Wolf Read


Introduction

By the end of 1996, Automated Surface Observing System (ASOS) stations had been commissioned at all of the official National Weather Service (NWS) stations in the western Pacific Northwest. With the implementation of the automated equipment, arrived a new methodology for measuring wind. Before ASOS, a gust was an instantaneous value taken from an analog anemometer with an indicator dial and/or strip-chart recorder. After ASOS, a 5-second average from a digital anemometer became the new gust. Given a high variability in wind speed over small spans of time, a 5-second average, which flattens the short-period changes in wind speed, is likely to be considerably lower than an instant reading.

For a rigorous examination of windstorm climatology, this reality is not trivial. The 5-second gust is a completely different measure than the peak instant gust that was formerly used by the NWS. This issue has been covered in a number of webpages on this site, including the case studies for the December 12, 1995 and January 16, 2000 windstorms. This essay will examine the climatological problems that result from a 5-second wind in a more systematic manner. This is important, for the 5-sec gust measure nearly invalidates comparison between storms of history with those of today. For example, it is possible that the new 5-second peak "masked" some of the storms, due to a tendency for significantly lower wind-speed numbers compared to pre-ASOS events. In other words, a major storm have struck and not produced the expected peak gust signature owing to the difference in measure.

An even newer complication with gust measurement has occurred in the 2003-2007 timeframe. The NWS switched from cup-based anemometers to sonic versions in this period, with many being commissioned in the western Pacific Northwest during 2007. With sonic anemometers, gust measure is changed again. This time to a 3-second average, which is the international standard, and used in engineering circles to help develop building codes. A 3-second gust is somewhat different from a 5-second gust. Also, sonic anemometers are purely digital systems that have no moving parts; they are a dramatically different instrument for wind measure compared to the cup-based analog systems employed before ASOS, and a substantially different instrument compared to the cup-based digital systems employed during the first decade of ASOS.

The cup-based anemometers of yesteryear, relative to sonic systems, have inertial-response issues, both in terms of the cups spinning-up during a gust, and in the movement of the indicator needle or pen or strip-chart depending on what equipment was in use. Depending on the source, it is thought that an instant gust on the old anemometer systems is akin to a 1-sec to 3-sec average.

Nevertheless, the 3-sec gust on sonic anemometers is anticipated by the NWS to be more akin to the old instant gust readings. However, early evidence (based on observations during the 2007-08 storm season) points to the 3-sec gust on sonic anemometers perhaps being slightly high relative to the old instant gust. Gust ratios on modern sonic systems appear to be higher compared to the systems of old, especially during strong storms. These new sonic anemometers are clearly a new complication to comparative analysis of storm systems over time, one that will be explored in-depth hopefully soon.

To help clarify the issues, take some wind records for Astoria, OR, for example. On October 12, 1962, Astoria reported a peak instant gust of 96 mph on an analog cup-based anemometer; on March 3, 1999, Astoria reported a peak 5-second gust of 66 mph on a digital cup-based anemometer; and, on December 3, 2007, Astoria reported a peak 3-second gust of 94 mph on a digital sonic anemometer. Given the change in equipment, and gust measure, are these numbers in any way directly comparable?

The following discussion primarily focuses on what can be termed the "Five-Second Gust Era," which, for the majority of western Pacific Northwest stations occurred from 1996-2006, with some stations like Astoria being changed to ASOS as early as 1993. Examination will primarily be on the 5-second gust. The 3-second gust is also explored, but only peripherally. Note that the data presented on the 3-second gust was collected on a cup-based system, and the results are probably not applicable to sonic anemometer systems.

Discussion

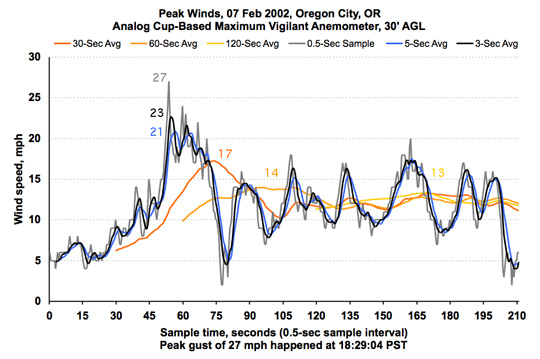
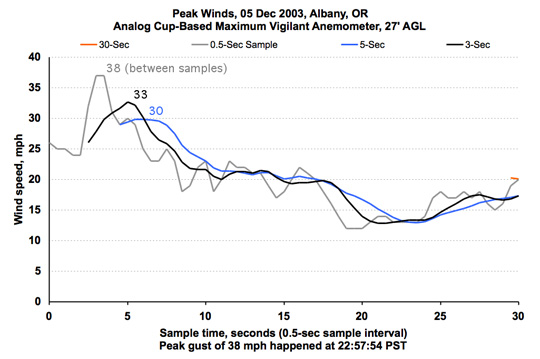
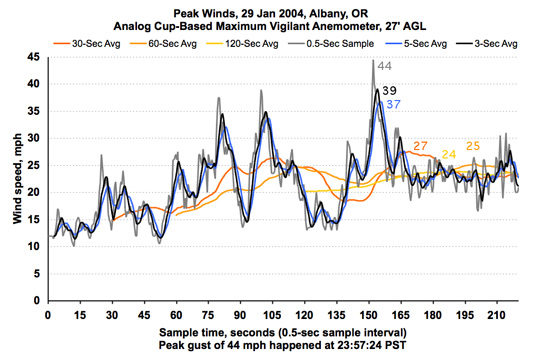
A 5-second "gust" is something entirely different from an instant gust. The former is an average, so technically it should be called a 5-second "wind" (and usually is by the NWS and NCDC). An instant gust is a direct reading, though arguably on cup-based systems inertial response can be considered to be an averaging mechanism. A specific value for a 5-second wind can contain much higher instant readings within its duration. Figures 1 through 3, below, demonstrate the high-frequency variance in speed that can be present in wind.


Figure 1: Peak gust, Oregon City, OR, during the passage of the February 7, 2002 cyclone. Maximum speed for each averaging period indicated on the chart. Peak instant gust 27 mph, peak 3-second wind 23 mph and peak 5-second wind 21 mph. Same wind gust, different measure.


Figure 2: Peak gust, Albany, OR, for the December 5, 2003 passage of a strong open wave. Maximum speed for each averaging period indicated on the chart. Peak instant gust 38 mph, peak 3-second wind 33 mph and peak 5-second wind 30 mph.


Figure 3: Peak gust, Albany, OR, for the January 29, 2004 passage of a strong cyclone. Maximum speed for each averaging period indicated on the chart. Peak instant gust 44 mph, peak 3-second wind 39 mph and peak 5-second wind 37 mph.


The above figures focus on short time periods around the peak gusts of various storms, and show 0.5-second samples from a Maximum Vigilant anemometer and various average velocities calculated from the samples. The February 7, 2002 South Valley windstorm, which only gave the anemometer site a glancing blow, produced a gust of 27 mph, with a peak 5-second wind of just 21 mph. The December 5, 2003 open wave brought an instant gust of 38 mph, yet the peak 5-second average only managed 30 mph. The January 29, 2004 cyclone landed a gust to 44 mph, which resulted in a peak 5-second wind of 37 mph. These differences are significant, amounting to a factor of about 1.20 to 1.30. It is clear that the 5-second average smoothed out the spikes--peak instant gust is lost in the longer-term measure.

The values and actual ratios are listed below in Table 1. Official readings taken during the December 12, 1995 windstorm are included. It is fortunate that the old direct-reading anemometer was still in operation then, and that the peak gust was noted by NWS personnel.


Table 1: Summary of known peak gust to 5-second wind measures. The NWS readings were from two different systems, the old direct-reading equipment and the ASOS sensor, a fact that confounds the estimation.

Maximum Vigilant Values (Unofficial)
  Peak Velocities, mph
Date of Event Instant 5-second Ratio
07-Feb-2002 27 21 1.29
05-Dec-2003 38 30 1.27
29-Jan-2004 44 37 1.21
       
NWS Measures (Official, from Portland, OR)
Date of Event Instant 5-second Ratio
12-Dec-1995 74 62 1.19
       
    Average 1.24

Table 2, below, compares the 3-second average to the instant readings. As expected, the ratios are less than with the 5-second average. Interestingly and coincidentally, the average turns out to match the 1.15 conversion for knots to mph. Note that this is a 3-second wind as measured on a cup-based anemometer system, not a sonic anemometer, and therefore these ratios are likely not useful for converting NWS gust readings post-2006.

Table 2: Summary of known peak gust to 3-second wind measures.

Maximum Vigilant Values (Unofficial)
  Peak Velocities, mph
Date of Event Instant 3-second Ratio
07-Feb-2002 27 23 1.17
05-Dec-2003 38 33 1.15
29-Jan-2004 44 39 1.13
 
    Average 1.15

The information in Table 1 can be used to make an instant-peak-gust estimation for windstorms that occurred during the five-second gust era. There is some evidence of a trend in the above data where the ratio decreases as the peak gust increases, suggesting that the higher the gust, the longer its duration. If this is true, using the straight average of the ratios would result in overestimation of peak gusts at the high end. For the following calculations, the 1.19 ratio from the official data will be used for the peak gust adjustments. At some point a sliding scale might be employed for finer-tuned estimations--this probably won't happen until more data is added to the above list, especially for faster than 27, 38 and 44 mph peak gust readings.

Outside the peak gust, a number of significant gusts are indicated in some of the charts in Figures 1 through 3. The January 29, 2004 cyclone produced a number of surges that were on par, or faster than the other storms. These data provide an opportunity to further scrutinize the 5-sec-gust / instant-gust ratio.

Looking specifically at the chart for the January 29, 2004 storm event, there are many waves in the data, some larger than others. Since the focus of the research presented on this website is peak gust, and there may be something unique about a peak gust relative to the other, slower gusts in a windstorm, logically an analysis of a continuous wind trace should concentrate on surges in wind speed that resemble the peak gust. Using the available data, a standard, or rule, should be developed for isolating legitimate gusts that also adequately describes the peak gust. Looking at the 5-second wind during the peak gust, the ratio of peak, 37 mph, to the preceding trough, 23 mph is about 1.61. Interestingly, this happens to be very close to the Golden Ratio of 1.618. Using a rounded version of the ratio as a guide, any change in wind speed with a peak-speed / preceding-trough-speed ratio of about 1.6 or greater counts as a legitimate gust.

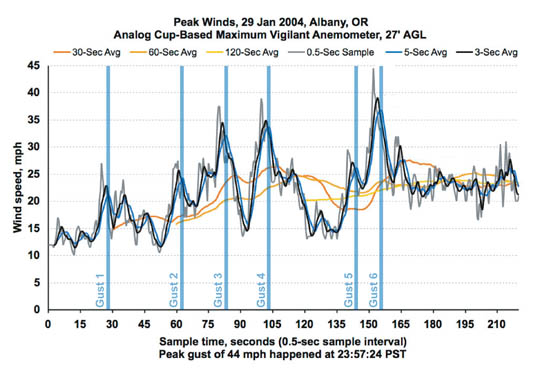
When this methodology is employed, six gusts are identified in the January 29, 2004 record. These are shown in Figure 4, below. The ratios for all these gusts are above 1.6 save in the case of gust-3. For gust-3, the brief, and very shallow trough at about 80 seconds results in a ratio of about 1.3. However, given that there is a more significant trough at about 65 seconds, ahead of the brief stall in wind speed acceleration, gust-3 is considered valid as it results in a ratio of 1.7. Gust-5, which has a very shallow trough afterward on the way up to the peak gust, is perhaps more questionable than gust-3. Figure 4 is provided, in part, to let the reader decide on the veracity of these identified gusts.


Figure 4: In the high-resolution record of the January 29, 2004 peak wind period at Albany, OR, six gusts are identified. The basic gust criteria is to have a trough-to-peak ratio of approximately 1.6 (peak/trough), the value for the peak gust during this storm. The vertical blue lines indicating the various gusts are centered on the peak 5-second wind speed.


The data for the six gusts are provided in Table 3, below. The average ratio of instant-gust to 5-second gust is around 1.19, with a range of 1.15 to 1.29. In other words, instant gust--as determined by taking 0.5-second samples from the indicator dial of an analog cup-based anemometer during the highest wind phase of a single storm event--tends to be approximately 20% higher than 5-second gust. The average ratio of instant-gust to 3-second gust is around 1.12, with a range of 1.08 to 1.17. Instant gust tends to be approximately 10% higher than 3-second gust. These numbers probably delimit good rules-of-thumb: The conversion for 5-sec to instant is 1.2, and 3-sec to instant is 1.1.

Table 3: Gust Data Collected from the January 29, 2004 Gale
Gust Trough
5-sec
mph
Peak
5-sec Gust
mph
Ratio
Peak /
Trough
Instant
Gust
mph
Peak
3-sec Gust
mph
Ratio
Instant /
5-sec
Ratio
Instant /
3-sec
Gust 1 13 21 1.62 27 23 1.29 1.17
Gust 2 12 24 2.00 28 26 1.17 1.08
Gust 3 24 32 1.33 38 35 1.19 1.09
Gust 4 16 34 2.13 39 35 1.15 1.11
Gust 5 15 26 1.73 30 27 1.15 1.11
Gust 6 23 37 1.61 44 39 1.19 1.13
Averages 1.74 1.19 1.12

The values given in Table 3 support the ratios from the other wind events that are listed in Tables 1 and 2. These data lend some weight to the idea of a ~1.2 conversion factor for 5-second gust to instant gust.

To be slightly more conservative than 1.2, the 1.19 adjustment factor supported by NWS equipment during the December 12, 1995 windstorm is used on some wind events from 1995-2006. The results appear in Table 4, below.


Table 4: Peak Gust Adjustments for "Modern" Storms, 1995-2006, mph.
High wind warning criteria gusts (58 mph or more) are shown in red.
Storm
ACV
OTH
AST
UIL
MFR
EUG
SLE
PDX
OLM
SEA
BLI
Avg
12Dec1995*
Official
58
86
62
61
45
49
59
62
57
60
76
61.4
Adjusted
58
86
72
61
54
58
70
74
57
60
76
66.1
01Jan1997
Official
46
64
56
47
25
45
41
51
46
39
55
46.8
Adjusted
55
76
67
56
30
54
49
61
55
46
65
55.7
05Feb1999
Official
15
52
49
43
13
35
39
43
38
40
55
38.4
Adjusted
18
62
58
51
15
42
46
51
45
48
65
45.7
06Feb1999
Official
33
54
55
31
40
46
43
40
37
45
40
42.2
Adjusted
39
64
65
37
48
55
51
48
44
54
48
50.2
03Mar1999
Official
40
49
66
55
38
52
46
51
47
60
63
51.5
Adjusted
48
58
79
65
45
62
55
61
56
71
75
61.3
16Jan2000
Official
47
51
66
45
39
39
60
59
54
52
66
52.5
Adjusted
56
61
79
54
46
46
71
70
64
62
79
62.5
13Dec2001
Official
43
58
49
50
26
36
45
38
40
40
41
42.4
Adjusted
51
69
58
60
31
43
54
45
48
48
49
50.4
07Feb2002
Official
39
53
33
10
36
70
31
31
16
21
21
32.8
Adjusted
46
63
39
12
43
83
37
37
19
25
25
39.1
27Dec2002
Official
32
61
59
32
30
39
37
39
40
52
22
40.3
Adjusted
38
73
70
38
36
46
44
46
48
62
26
47.9
05Dec2003
Official
24
45
49
36
15
30
33
31
37
32
43
34.1
Adjusted
29
54
58
43
18
36
39
37
44
38
51
40.6
29Jan2004
Official
36
48
47
47
47
39
44
41
37
40
43
42.6
Adjusted
43
57
56
56
56
46
52
49
44
48
51
50.7
25Dec2005
Official 35 55 54 36 30 37 35 46 41 38 48 41.3
Adjusted 42 65 64 43 36 44 42 55 49 45 57 49.1
01Jan2006
Official 45 43 46 51 35 41 45 44 45 49 53 45.2
Adjusted 54 51 55 61 42 49 54 52 54 58 63 53.8
04Feb2006
Official
39
51
59
53
32
46
39
44
43
47
62
46.8
Adjusted 46 61 70 63 38 55 46 52 51 56 74 55.7
14Dec2006**
Official 36 48 69 59 47 54 53 53 53 69 55 54.2
Adjusted 43 57 82 70 56 64 63 63 63 82 65 64.5
ACV OTH AST UIL MFR EUG SLE PDX OLM SEA BLI Avg
* Dec 1995: Not all stations had switched to ASOS; these values are left unadjusted.
** Dec 2006: Gusts for OTH and OLM may be low due to data interruptions. Gusts are highest reported.
Numbers in italics are values extrapolated from peak 2-minute wind by applying a standard 1.3 gust factor.

Before entering the discussion, it should be noted what the adjusted values in Table 4 are not. Likely, the adjusted values are not the actual peak instant-gust from the sample storms. The actual maximum instant-gust could have been lower, or even higher. The number simply represents a realistic approximation for the peak instant gust. The official gust value provides the lower boundary. Most likely, the real value lies between the two numbers.

That said, we can do some comparisons. The December 12, 1995 storm still stands on top of everything that has occurred during the ASOS era. However, two storms, when adjusted, become close in average gust strength to the 1995 event: March 3, 1999 and January 16, 2000. And more importantly, the December 14, 2006 windstorm very closely approached the overall gust strength of the December 12, 1995 cyclone. Indeed, during the 2006 storm, wind gusts may have been higher than indicated in Table 4 for two stations that experienced data interruption. Perhaps the storm of 2006 at least equaled the 1995 event. Given the eleven year separation, perhaps these two windstorms can be considered good approximations for "storm-of-the-decade" events, with November 14, 1981 (shown in Table 6, below) holding the title for the 1980s.

By my own breakdown, storms that produce a peak gust average of 55.0 or greater at the 11 stations are considered "major" events. The adjustments elevated the three abovementioned storms well into this category, from positions that were still a strong showing, but not of "epic" proportions. Storm that rank in the 60s are very rare; the adjustments reveal that possibly two happened in less than a year in 1999-2000--a noteworthy happenstance. But this is not known for certain--that is the problem with the change in wind measure brought by ASOS.

A few details could help with assessing just how powerful the March 3, 1999, January 16, 2000 and December 14, 2006 events were.

The March 3, 1999 storm caused some incredible wind gusts unofficially, and much damage. It is considered by forecasters as being one of the most intense storms in recent memory. The March 1999 Storm Data publication from the NCDC shows unofficial gusts of 120 mph at Depoe Bay, 105 at Cannon Beach, 92 at Tillamook along the Oregon coast, and 77 mph at Sandy and 75 mph at Sheridan in the Willamette Valley. Instrument exposure and calibration notwithstanding, these values suggest that the 1.19 factor may underestimate the power of the March 3, 1999 event. This storm looks every bit as bad as the December 12, 1995 windstorm. For another example, in Washington, the Evergreen Point Floating Bridge was closed during the March 3, 1999 gale--an eventuality that hadn't happened since the 1995 storm.

The January 16, 2000 sou'wester also appears quite intense. The January 2000 Storm Data shows unofficial gusts of 115 mph at Cannon Beach, 87 at Newport (officially 60 mph) and 80 mph at the Newport Jetty. No unofficial observations for the Willamette Valley are available, but the data suggest a storm of similar magnitude to March 3, 1999. Instant gusts into the low 70s are not out of line for the Salem to Portland region. The Storm Data publication also notes the closure of the Evergreen Point Floating Bridge during the January 16, 2000 event, suggesting a similarity to the big 1999 and 1995 storms.

During the December 14, 2006 windstorm, unofficial gusts reached 65-80 in the Willamette Valley, well above the adjusted official readings in the region. On the coast, unofficial readings included 79 mph at Cannon Beach, 82 mph at the Newport Courthouse and 97 mph at Rockaway Beach. In Washington, both the Hood Canal and Evergreen Point Floating Bridges were closed due to the wind strength in this storm.

So, was December 12, 1995 the last truly major storm? The evidence suggests, "No." The March 3, 1999, January 16, 2000 and December 14, 2006 events appear to belong in this "esteemed" category.

Rough Windstorm Return Intervals and Expanded Categories

Using the 55 mph cutoff, six major events (January 1, 1997 and February 4, 2006 make the cut) happened in the eleven years 1995-2006: On average, that is one big windstorm about every other year. Elevating the cutoff to an average peak gust of 60 mph, four events occurred in the eleven-year timeframe, or about one big windstorm every three years. Lifting the cutoff to an average peak gust of 65 mph, definitely one, and perhaps two (December 14-15, 2006), event(s) occurred within the span of eleven years. This suggests the threshold for storm-of-the-decade may be around an average peak gust of 65 mph. A new category is suggested: Extreme windstorm.

Since categories are being added, it makes sense to provide an even higher category, one that accommodates the Columbus Day Storm, which had an average peak gust of 80.5 mph: Phenomenal. This brings the number of windstorm categories to five, sort of like the Saffir-Simpson scale for hurricanes, but via a significantly different method for rating storm strength, as the windstorm categories use gust (not wind) at specific stations.

For clarity, cutoffs for the windstorm categories are included in Table 5, below.

Table 5: The Expanded Windstorm Categories
Average Peak
Instant Gust (mph)
Windstorm Category
Approximate Return Interval
39 to 44 Minor Several per year
45 to 54 Moderate Annual (the endemic storm)
55 to 64 Major Once every 2-3 years
65 to 74 Extreme Once every 5-10 years
75+ Phenomenal Once every 25-50 years
Average-peak-instant-gust is based on the average of peak gusts for these stations: ACV, OTH, AST, UIL, MFR, EUG, SLE, PDX, OLM, SEA and BLI.

Peak 5-Second Gust of 70 mph or More: A Very Rare Event

It is noteworthy that not a single ASOS station managed to show a peak gust of 70 mph or more in Table 4, save for Eugene during the February 7, 2002 windstorm. Not even the better-located coastal stations have recorded gusts as high [Footnote 1]. This serves to emphasize the significance of that 70 mph wind gust at Eugene, and the true power of the February 7, 2002 windstorm. Considering the damage wrought by this mesoscale event, which included swathing of trees, physical damage to structures by raw wind force, and lines of power-poles being toppled--relatively new poles that were rated at 112 mph!--the 83 mph instant gust estimate at Eugene seems an appropriate estimate, if a bit low! It appears that Eugene, and the South Willamette Valley, were visited by wind speeds comparable to the great Columbus Day Storm of 1962. Eugene's peak instant gust during the "mother of all windstorms" was 86 mph, highest ever recorded at the station. Just for the sake of examination, the average of the gust adjustment ratios in Table 1 yields an estimated peak gust of 88 mph at Eugene; higher than the peak for the 1962 Big Blow.

Had storm watchers received their long awaited Columbus-Day winds, or did the February 7, 2002 windstorm fall short? We will never truly know if 83, 86 or 88 mph was the case for February 7, 2002, or if the highest gust was simply the 70 mph shown by the ASOS. Unfortunately, unofficial instant-gust readings for this storm's main strike zone are absent from the record (such as Storm Data). All we have are the estimates in Table 4, and the visible storm damage to suggest that, indeed, winds approaching Columbus Day strength visited the south Willamette Valley in 2002.

Converting Instant Gust to 5-Second Gust

There is another way to look at what the 5-second gust means for windstorm comparisons. The calculations can be done in reverse for historic storms to estimate what the maximum 5-second wind might have been. The resutls for two big storms in history, the Columbus Day Storm of 1962 and November 14, 1981, are presented in Table 6, below.

Table 6: Peak Gust Adjusted to 5-Second Wind for Two Major Storms of History
High wind warning criteria gusts (58 mph or more) are shown in red.
Storm
ACV
OTH
AST
UIL
MFR
EUG
SLE
PDX
OLM
SEA
BLI
Avg
12Oct1962*
Official
58
81
96
78
58
86
90
104
78
58
98
80.5
Adjusted
49
68
81
66
49
72
76
87
66
49
82
67.6
14Nov1981
Official
60
92
68
48
62
58
71
71
64
67
64
65.9
Adjusted
50
77
57
40
52
49
60
60
54
56
54
55.4
* For the 1962 storm, TTI is substituded for UIL.

Storm watchers, pay close attention to the modified readings for the Columbus Day Storm. That's the 5-sec gust signature of a "storm-of-the-century" event. The extreme instant gust values are reduced considerably, with the storm's average falling close to the unmodified value for the November 14, 1981 windstorm. With peak gusts depicted in estimated 5-second averages, the Columbus Day Storm stands out somewhat less. Gusts in the 60s and 70s don't seem as spectacular as 80s, 90s, and 100s. Nevertheless, even with the reduction, some stations still have a strong showing, including Portland, OR, with an 87 mph 5-second wind. Of course, the 104 mph was an estimate--a necessity as the storm knocked out power early and shut down the direct-reading wind equipment. Using the measured value of 106 mph at Troutdale, we get 89 mph, which does stand out, and is a close match to an 88 mph "fastest mile" (88 mph 41-second wind) at Portland that was recorded near the beginning of the storm. In any event, a Columbus-Day type of event would show up numerically less strongly in a 5-second wind regime, but, owing to some stations being subjected to particularly strong winds (and the physical reality of the kind of damage such a storm would cause), will still stand out as something unusual.

For an extreme, but not Columbus-Day-Storm-extreme, event like November 14, 1981, the story is different. Save for at North Bend, the peak wind values do not stand out much. Many storms in history have produced 50 to 60 mph instant gusts. The average of 55.4 is still in major category, but is right at the borderline. This clearly demonstrates how peak 5-second gusts can "mask" a rare windstorm. This table suggests that the 5-second gust signature for a major event is 50 to 60 mph gusts, not 60 to 75.

There's another twist to the story being examined here: What happens to the frequency of high wind warnings between the pre and post 5-second-gust eras? Did more than one standard for a high wind event, by NWS definition, change?

High Wind Warnings in the Five-Second Gust Era

National Weather Service criteria for a high wind warning (HWW) event is for gusts of 50 knots, or 58 mph, to occur within the warning area. Gusts meeting this criterion are shown in red in Tables 2 and 3. This definition has been around some time; minimum HWW criteria during the pre-ASOS era certainly wasn't higher. I recall a few high wind warnings for 55 mph gusts in the Seattle area during the 1980s.

If the NWS bases its wind forecasts on how the official stations respond, then, quite possibly the frequency of HWW might have decreased since the inception of ASOS. Note that three storms in Table 4 did not produce HWW criteria "gusts" under the official peak 5-second wind record of ASOS: February 5, 1999, February 6, 1999 and December 3, 2003. Yet, based on the 1.19 adjustment factor, it appears that these three events could have achieved gusts of 58 mph or higher at coastal stations. For the last storm, this point is kind of moot, for a HWW was issued for the coast (one that was verified by stations not included in the table).

High wind warnings for the interior sections, like the Willamette Valley, are rare. The difference between peak 5-second wind and peak instant gust is probably more significant than on the coast, where gusts to 60 and 70 mph are regular occurrences during the winter season. The January 1, 1997, March 3, 1999 and December 27, 2002 windstorms, which generally didn't have a strong showing in the interior for 5-second wind measures (save SEA and BLI in 1999), meet HWW criteria with the peak instant gust adjustment, either at one point, or over a wider portion of the inland region.

Another way of looking at this is with Table 6, especially the November 14, 1981 windstorm. The number of stations meeting HWW criteria drops from 10 to 3 when the peak instant gusts are adjusted to 5-second wind! The storm appears to barely meet the high wind warning standard, yet it was one of the biggest in history.

It seems that the standard for high wind was automatically changed by employing a new peak 5-second "gust" at official stations. Instant gusts of 69 mph are a reasonable expectation when 5-second winds are approaching 58. So, the new ASOS era appears to have changed the HWW criteria to approximately a minimum of 70 mph for instant gust. The other way to look at this is that peak 5-second winds of 48 to 50 mph (implying potential instant gusts of 57 to 60 mph) at ASOS stations would have likely met the minimum HWW criteria pre-ASOS. It seems that 5-second "gusts" of 43 knots, approximately 50 mph, might have been a reasonable new criteria for high wind warnings, certainly for interior sections of the Pacific Northwest (there's good reason to distinguish between coastal and interior regions when providing wind advisories and warnings, a topic in its own right).

Since it's doubtful that 58 mph instant gusts have changed in force during the implementation of the 5-second gust, it's interesting that the NWS has kept the 58 mph minimum for HWW when using a 5-second wind to "verify" warnings. Skywarn spotter reports probably reduce this issue to some extent. A number of personal anemometers still report instant gust in analog format (Maximum equipment being one example), though digital stations that show short-duration averages, like 2.5-seconds on Davis systems, are also common, watering down the effect.

The bottom line: The 5-second gust era of 1996-2006 was different from the periods both before and after. A 5-second average on a cup-based anemometer system is a unique kind of wind measure. This should be kept in mind when trying assess the strength of a particular wind event relative to other storms in history.


Footnotes

[Footnote 1] Certain stations, like Cape Arago and Cape Blanco, of course, have recorded significantly faster 5-second winds, but these are among the most wind-favored locations in the Northwest and aren't included in Table 2.


Last Modified: November 29, 2008
Page Created: December 9, 2003

| Back |