The Classic Windstorm of December 11, 2014

compiled by

Wolf Read


1.0 Introduction


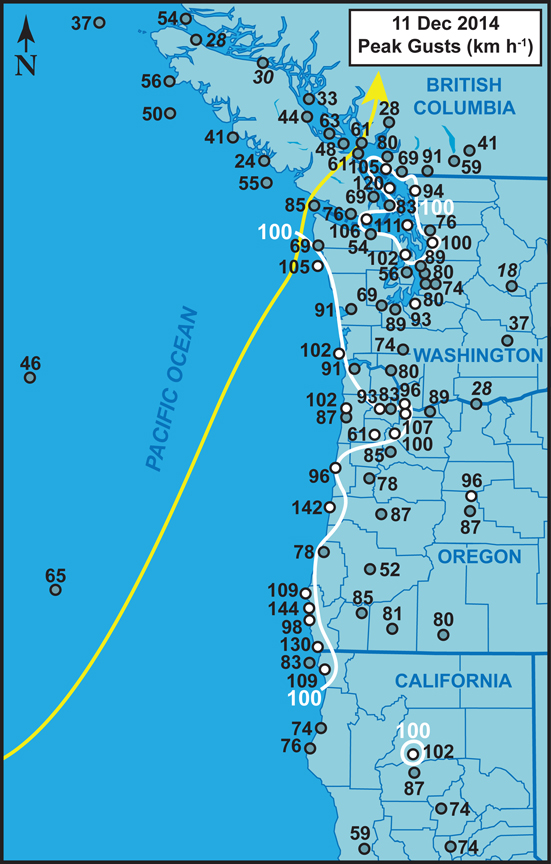
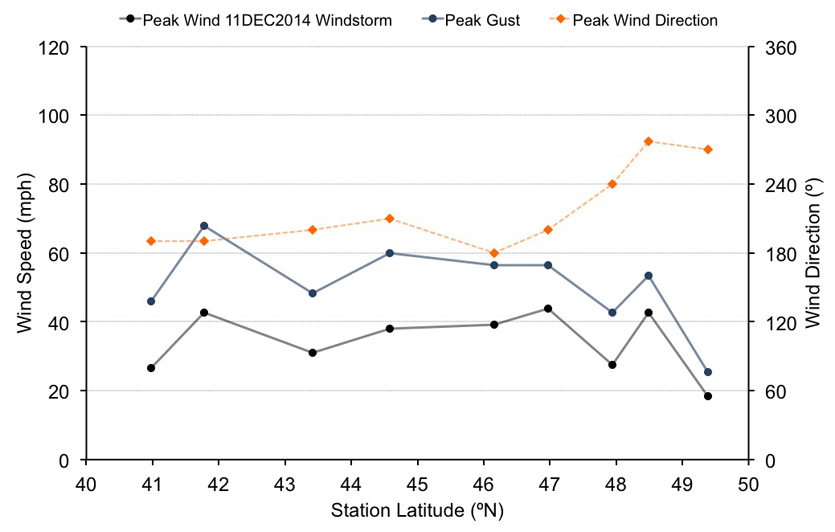
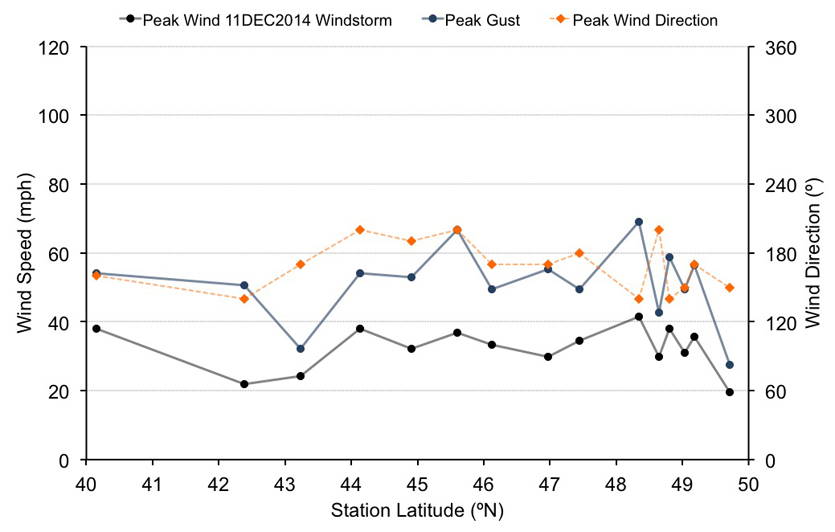
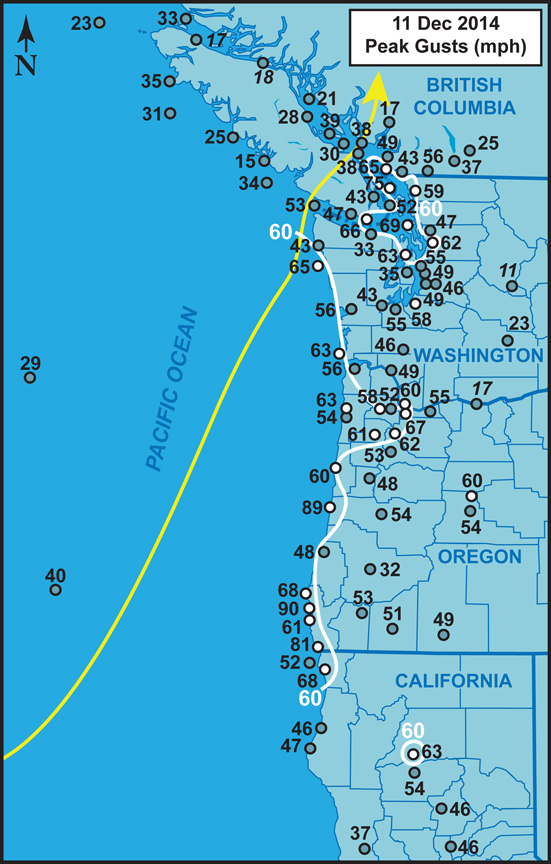
Figure 1.1 above Peak gusts (mph and km/h) for the December 11, 2014 windstorm. Wind speeds are largely from long-term surface airways weather observation sites, data buoys, lighthouses and C-MAN stations, with limited data from other networks (e.g. RAWS). Stations with long histories are preferred because of the research focus on intercomparison of historic storms. Numbers preceded by a tilde (~) represents the highest gust report in a dataset that has been interrupted at the height of the storm--usually data loss is from power outages. Values in italics are gust values estimated from peak wind, typically 2-minute or 5-minute, using a 1.3 gust factor. Stations with high-wind criteria gusts (≥58 mph or 93 km/h) are denoted with white-filled circles. Isotachs depicting ≥60 mph (~100 km/h) gusts are included to highlight the regions that had concentrations of the indicated magnitudes. The track of the extratropical cyclone center is shown (yellow arrow). Click on the map to see a larger version. Here is a map listing the station names.


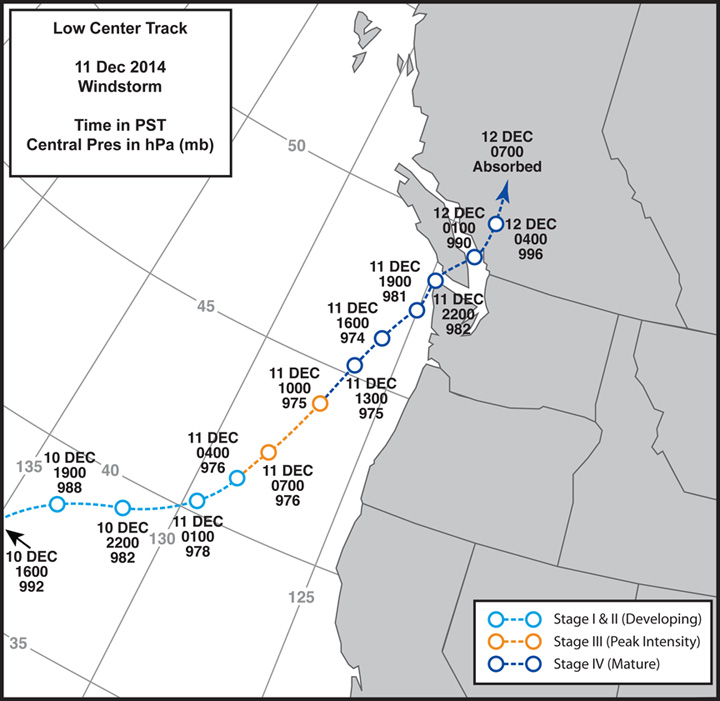
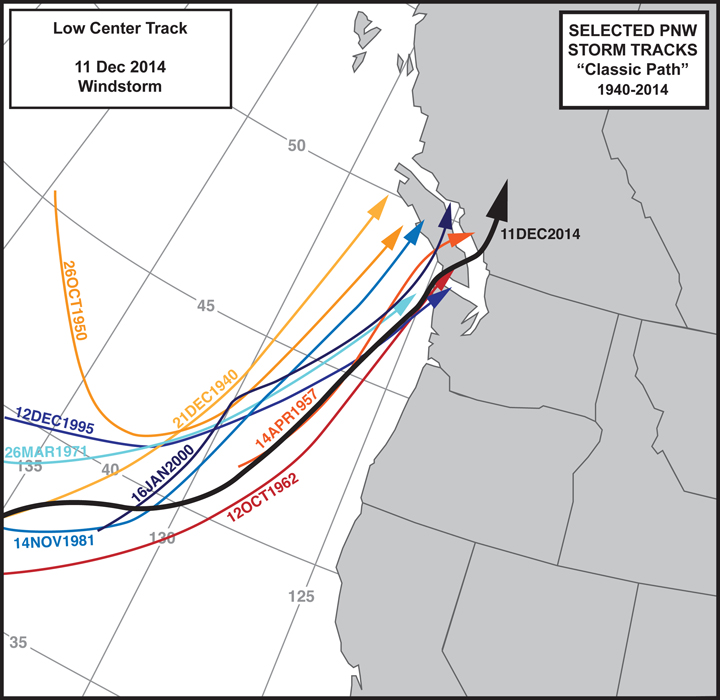
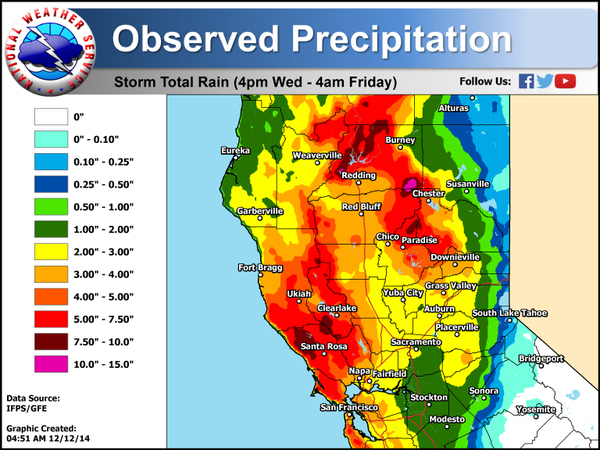
Strong classic windstorms are rare. Since the January 16, 2000 tempest, nearly fifteen years passed before the next such storm visited the West Coast. The December 11, 2014 extratropical cyclone arrived during a very active period (2014 and 2015) that contained several high-wind events of note, including a somewhat similar storm on October 25, 2014 and an unusual summer windstorm on August 29, 2015, many of which followed meridional tracks that are the hallmark of classic windstorms.

The December 11, 2014 windstorm brought peak gusts of 60-90 mph (95-145 km/h) to the coast of extreme northwest California and also southwest Oregon with a lower range of 55-65 mph (90-105 km/h) from northwest Oregon to the Olympic Peninsula of Washington (Figure 1.1). Over the interior sections, winds of 50-55 mph (80-90 km/h) struck the southern Willamette Valley. In sharp contrast, but also in a familiar pattern for classic-path windstorms, the northern Valley received much stronger 60-65 mph (95-105 km/h)--even higher--gusts. The southwest Washington interior and Puget Lowlands generally experienced lower winds than the northern Willamette Valley, another pattern that has often appeared with classic windstorms, with peaks generally in the range of 45-55 mph (70-90 km/h). North of this region, stretching into the southern Georgia Strait, wind gusts were again intense, around 60-70 mph (95-115 km/h). However, the inland areas of British Columbia's Lower Mainland, and much of the greater Victoria area had wind gusts similar to the Puget Lowlands.

Due to heavy precipitation in California, including amid the San Francisco Bay Area, widespread urban flooding, some river flooding and mudslides occurred with numerous road closures (NCDC 2014). At some locations, homes were inundated by rapidly-rising waters. The roof of a grocery store in San Jose underwent partial collapse from the water load. Trees weakened or dead from prolonged drought toppled easily under lowland wind gusts of 40-55 mph (65-90 km/h), causing additional road closures and widespread power outages that affected hundreds of thousands of residents across northern California.

In Oregon, one fatality and serious injury occurred in Portland Metro due to a tree falling on a car (Zarkhin 2014). Debris, fallen trees and downed wires blocked roads (Fernandez 2014). Siding torn from the Pacwest Center office tower crashed through some windows on the Standard Building, resulting in more street closures. Heavy winds forced the closure of the tram service, and Max light rail trains experienced delays due to power outages. Near the Lloyd Center, large pieces of material were blown off of a building under construction and tumbled down the street, smashing windows and causing terror among those caught in the spectacle (Paul Bonine, personal communication, November 17, 2015). Widespread downed trees caused numerous outages, especially in the northern Willamette Valley (NCDC 2014), with Portland General Electric reporting nearly 83,000 customers, or 9.8% of the customer base, out at peak (Cari P., PGE, personal communication, October 28, 2015). As stoplights darkened, traffic became snarled in places (Woolington 2014).

Similar events repeated as the storm tracked northward. In Washington, approximately 246,000 customers without electrical service at the height of the storm (NCDC 2014). Many roads were closed by fallen trees and other debris. Windthrow struck a propane tank near a casino, causing a large fire. In southwest British Columbia at least 78,000 customers (BC Hydro 2014), or 5.5% of the customer base, lost power at the storm's peak, mainly the result of broken trees and branches.


2.0 Synoptic Analysis


2.1 Storm Track


Figure 2.1 above Storm track estimation largely based on surface maps provided by the US. NOAA Weather Prediction Center. Date and time in PST and central pressure in hPa (mb).


Figure 2.2 above The December 11, 2014 track (heavy black line) compared to other classic-path windstorms (various colors).


The extratropical cyclone intensified far to the south off of the California coast (Figure 2.1), moved northeast to east-northeast inside 130ºW at about 40ºN and then tracked north-northeast to Tatoosh and Vancouver Islands, with the low center gradually closing in on the coast as storm tracked northward. This is a great example of the classic path. The midlatitude cyclone reached a peak depth of approximately 974 hPa around 1600 PST on December 11, 2014, while off the mouth of the Columbia River. Other classic windstorms have also showed this tendency--reaching max depth while approximately off the Oregon coast and weakening before landfall on either the northwest tip of Washington or Vancouver Island. Thus, the low had peak depth while closest to Oregon, but in fact moved closer to Washington even as it weakened, roughly evening out the potential difference in impact.

The center of the December 11, 2014 extratropical cyclone tracked very close to the path of the 1962 Columbus Day Storm (Figure 2.2), in fact much closer than the major November 14, 1981 and December 12, 1995 windstorms.

The low-pressure center traveled approximately 690 miles (1,100 km) during the 24 hours from 0100 PST on Dec 11th to 0100 on the 12th. Thus, the system moved with an average forward speed of 29 mph (46 km/h), not as fast as some other classic windstorms. For example, the Columbus Day Storm tracked 465 miles (765 km) from 1000 to 2200 on October 12, 1962 for an average forward speed of 39 mph (62 km/h). The pace of the 2014 storm is closer to but still below the November 14, 1981 extratropical cyclone, which covered 645 miles (1040 km) in 21 hours as it moved up the coast, for an average speed of 31 mph (50 km/h). The January 16, 2000 windstorm had the relatively slow pace of 24 mph (38 km/h) as it moved from the waters off of southwest Oregon to west of Quillayute (KUIL) from 16:30 on January 15th to 13:00 on the 16th, a distance of 484 miles (780 km). Note that these are averages over fairly long time periods of 12- 24 hr, and that the forward speed of extratropical cyclones can vary over smaller time scales. For example, the Columbus Day Storm had a rate of about 51 mph (82 km/h) over 3 hr as it tracked off the Oregon Coast, and the December 11, 2014 storm had a 3 hr speed of 44 mph (72 km/h) off nearly the same stretch of coast.


2.2 Synoptic Charts


Figure 2.3 above Synoptic chart for 0000 UTC December 12, 2014 (1600 PST December 11, 2014). Orange shading depicts the 300 hPa jet stream, with brown italicized numbers labeling isotachs in m/s. Some radiosonde wind observations are included (in black) mainly to show conditions in the study region (2.5 m/s per half barb and 25 m/s per pennant). For the 500 hPa level black lines denote heights in dm. Upper lows and central heights are also marked in black. Isotherms in ºC are indicated with white dashed lines. Surface lows and central pressures in hPa are indicated with dark blue, with tracks in light blue. Key surface anticyclones are indicated in red.


Figure 2.4 above Synoptic chart for 1200 UTC (0400 PST) December 12, 2014. See Figure 2.3 caption for the key.


A sharp U-shaped upper-trough, a typical pattern for classic-path windstorms, helped initiate the December 11, 2014 windstorm (Figures 2.3 and 2.4). Strong meridional jet streams help steer associated extratropical cyclones on a north-northeast track up the coast. For example, amplified troughs were also associated with the 1962 Columbus Day Storm and a bit less so the major windstorm of November 14, 1981 where a flatter trough steepened as the low neared the coast (Lynott and Cramer 1966, Reed and Albright 1986). The 2014 surface low developed near the base of the trough in a baroclinic zone and under the left-exit region of an intense 80 m/s (155 knot) jet streak 24 hr before Figure 2.3. As the extratropical cyclone lifted up the Pacific coast, the trough shifted east, becoming increasingly amplified as it tracked from 140ºW to about 120ºW over 48 hours. At the time of Figure 2.3, the low remained close to good upper support--the left exit region of the 65-70 m/s (125-135 knot) jet streak--while off of the northwest tip of Oregon. The surface low became further removed from the main jet axis by the time it tracked into mainland British Columbia and weakened considerably upon interaction with the steep coastal terrain (Figure 2.3).

By 0000 UTC on December 12, 2014 (1600 PST December 11), the surface low reached the latitude of Astoria at near peak depth, a favorable situation for strong southerly winds in northwest Oregon (Figure 2.3). The main jet axis sat right over the Willamette Valley, with SSW 65 m/s (135 knot) winds strongly supportive of high S winds at the surface given any vertical momentum mixing. Indeed, the Salem sounding at 16:00 PST on December 12th shows that height 349 hPa (7.9 km height) winds were screaming at 83 m/s (162 knots) out of 205º. Speeds drop off markedly below this height. However, at 850 hPa (1.3 km), winds were still a strong 33 m/s (65 knots) out of 199º. Height 850 winds can indicate the gust potential at the surface provided there is a vertical mixing mechanism. The peak wind gust at Portland (KPDX), 58 knots, nearly realized the potential.

To briefly focus on some relevant surface observations from three key stations, there is evidence of vertical mixing in the marked dew point depressions that occurred with the strongest winds in Portland (Figure 2.5). Also, with the temperature climbing to 63ºF (17.2ºC) at the onset of the main wind surge, it appears that the warm sector reached Portland. Warm sectors tend to be relatively unstable and prone to downdrafts that can mix down upper-level wind momentum (Mass and Dotson 2010).


Figure 2.5 above Meteogram for Portland (KPDX, orange), Seattle (KSEA, gray) and Vancouver (CYVR, blue) showing 2-min wind speed (mph), temperature (T, ºF) and dew point (Td, ºF) for the time period 00:00 PST to 10:00 PST on December 11-12, 2014.


The temperature did not get so warm at Sea-Tac, a modest 57ºF (13.9ºC), with Vancouver having the coolest maximum at 54ºF (12.2ºC) suggesting that the triple-point passed south of the Puget Lowlands (also indicated in Figure 2.3). The temperature warming at this location, and in Vancouver, BC, is likely the result of the occluded portion of the front mixing out a cooler surface air layer put in place during the offshore flow ahead of the storm. These easterly winds are indicated by sharp dew point depressions in the morning at Sea-Tac, with warming to 54ºF (12.2ºC) due to downsloping off of the Cascade Mountains. Precipitation ahead of the front then caused evaporational cooling before this layer mixed out when the arrival of the occlusion. Dew point depressions increased again as southerly winds escalated, suggesting the occurrence of vertical mixing post-front during peak winds in the Seattle area, just like at Portland but in this case in a post-occlusion environment, not post-warm front. There is a second but more modest escalation of winds at Sea-Tac around midnight, along with a cooler temperature and shallower dew point depression. Though Olympic Mountain lee troughing may have contributed to this wind escalation (see section 4.1 below), it is here suggested that this is more the mark of the bent-back front acting as a weak secondary cold front in the Seattle Area, bringing in cooler, more stable air. In such an eventuality, the relatively warm air put in place post-leading-occlusion can behave as a de-facto warm sector. Note that if the bent-back front did indeed interact with the Seattle area, it was the very edge of the wrap-around band, not even bringing precipitation.

Vancouver, BC, had a clearer passage of the bent-back front, with the arrival time between midnight and 01:00. Light precipitation moved through around midnight, followed by a secondary wind escalation, peaking at 01:00 at CYVR and perhaps a little later in some other parts of the metro area. The rate-of-rise in barometric pressure slowed down (shown in section 5.1 below) as the bent-back front moved in, followed by a fast rise, along with the arrival of cooler temperatures. The bent-back front was not strong by historical standards and is difficult to detect in the surface observations. Satellite photo interpretation also supports the bent-back front reaching Vancouver around 01:00 on the 12th.

Returning to consideration of upper wind conditions, the arrangement of an intense jet stream right over the Willamette Valley with a flow direction nearly parallel to the axis of the surrounding mountains is actually quite rare even among classic windstorms. The January 16, 2000 storm appears to have had a somewhat similar setup, though perhaps not as strong, with a 250 hPa (10.1 km) wind of 72 m/s (140 knots) out of 195º at 04:00 on the 16th, though height 850 winds were a modest 14 m/s (28 knots) out of 215º at this time. Winds increased to at least 26 m/s (50 knots) some 12 hours later, but from an imperfect 225º, and this after the jet stream moved away from the region. The major December 12, 1995 windstorm does not appear to have had such a good setup, this based on a partial sounding taken at Salem around 16:00 on December 12th, and a more complete record from Medford (KMFR) at the same time. Height 350 to 250 wind speeds were much slower than the 2014 extratropical cyclone, and though 32 m/s (63 knot) 850 winds during the 1995 storm were close, they had a not-so-ideal direction of 220º. The powerful November 14, 1981 windstorm also does not appear to have had the same kind of ideal setup seen on December 11, 2014, mainly because the jet stream core had a more zonal orientation that largely remained south of the Willamette Valley. Nevertheless, the 1981 storm brought over Salem intense 49 m/s (96 knot) 850 winds out of a nearly ideal 190º orientation at 04:00 on November 14th, one of the highest readings from this height on record for this location and likely the reflection of a very deep storm system that dominated the lower tropospheric environment over a huge area. Height 300 winds were a relatively modest 40 m/s (78 knots).

To be clear, the near-perfect setup during the 2014 windstorm likely explains the intense wind gusts in the northern Willamette Valley. Had the jet stream not been so favorably aligned, quite likely Valley wind speeds would have been less than they were--maybe peak gusts around 50-55 mph (80-90 km/h).With the jet axis to the east, the north Oregon coast did not have ideal upper support for strong surface winds, likely explaining the relatively low peak wind gusts, resulting in coast and interior peak wind speeds that were roughly the same (see section 3.5 below). Earlier, as the low tracked off the south Oregon coast, the main jet axis sat right over the shore, supporting the stronger wind readings in the southern region.

The narrative of upper-wind influence over Oregon also applied to Washington as the low tracked up the coast and across Vancouver Island over the next 12 hours (Figure 2.4), but is even more pronounced as the jet streak weakened to 55 m/s (125 knots) and moved over the Cascades. Thus, the Puget Lowlands did not have the same magnitude to upper support as the Willamette Valley, likely explaining in part the lower wind speeds in the region. In the north interior, an area that due to geography is prone to strong SE winds as lows approach the coast, the still strong surface pressure gradients (see pressure gradient sections below) supported wind gusts nearly on par with the Willamette Valley despite weaker upper support.

Peak pressure gradients during classic-path windstorms are usually at a time when the orientation--the pressure slope (Lange 1998)--is to the southeast. These events tend to be the most intense examples of the southeaster windstorm pattern, sometimes called "southeast suckers." The surface pressure conditions during these storms favor those locations that are exposed to SE winds. The Willamette Valley and Puget Lowlands, with north-south orientations, are not as ideally setup as Washington's north interior and the Georgia Strait. The latter two regions apparently do not need the same magnitude of upper support for intense winds during classic-path windstorms, though the tendency for southeast winds at lower levels (e.g. 850 hPa) in the northeast quadrant of extratropical cyclones probably does aid SE surface winds as the lows approach, provided some vertical mixing mechanism is present.

Interestingly, for the December 11, 2014 windstorm, the Puget Lowlands apparently had a good surface setup for high winds--perhaps on par with the north interior due to a nearly south pressure slope at the time of peak gradient (see section 3.4 below)--making the lower peak gusts seemingly an aberration. However, for much of the main storm period, the pressure slope had a less-than-ideal 135-155º orientation over the Puget Sound, perhaps a better indication of surface wind support than the single observation at peak gradient. Interestingly, this pattern of relatively lower peak gusts in the Puget Lowlands, especially in the Seattle Area, has shown up for a large proportion of classic path windstorms, including the 1962 Columbus Day Storm.


2.3 Satellite Photos


Figure 2.4 above Satellite photo composite of: a) four km resolution visible; b) four km water vapor; c) four km enhanced infrared; and d) one km visible images for 1800 UTC (1000 PST) on December 11, 2014 (d).


Figure 2.5 above Satellite photo composite showing four km resolution water vapor images for: a) 1500 UTC (0700 PST) on December 11, 2014; b) 1800 UTC; c) 2100 UTC; and d) 0200 UTC on the 12th (d). The images depict the upper-level low center moving from the waters offshore of Coos Bay, OR, to just west of Willapa Bay, WA, with the associated fronts sweeping far inland.


Satellite imagery reveals an extratropical cyclone with a fairly typical comma shape (Figure 2.4). There is some evidence of a more tightly-wound spiral near the center, which shows up as an eye-like feature in some water vapor images, but nothing like the multiply wound spirals of storms like November 14, 1981 or March 12, 2012. The December 11, 2014 windstorm did not have the central pressure depth of these other two storms. An enhanced dry slot, demarcating a region of subsidence and relatively clear skies, is visible near the center of the storm, but this feature is not as sharply defined as in some other events.

A sequence of satellite images during the time that the low tracked from offshore of Coos Bay, Oregon, to just off of Willapa Bay, Washington, reveals a storm system gradually losing definition as it tracks northward, with the dry slot fading over time (Figure 2.5). The storm appears to be at peak intensity, or Stage III in the Shapiro and Keyser (1990) framework, around 1500 UTC (0700 PST) on December 11, 2014 (Figure 2.4a), though peak depth did not occur until around 0000 UTC (1600 PST), when the system had clearly evolved to Stage IV. The leading frontal systems (warm and cold) moved inland ahead of the low, resulting in double-dip barometric pressure trends, the first being due to the cold/occluded front and the second the low's closest approach. Due to the meridional orientation of the upper flow, the fronts did not progress inland very rapidly. The jet stream core is raced northward right along the back edge of the cold/occluded front, with the dry slot to the west and the high cloud shield to the east, and is moved right over the Willamette valley around 2100 UTC (1300 PST) December 11, 2014 and later times.

The bent-back occlusion, wrapping around the rear-flank of the extratropical cyclone, did not interact strongly with the study region until the low landed on Vancouver Island. Peak winds, or at least a secondary escalation, over parts of the Washington's Olympic Peninsula and in the Lower Mainland of British Columbia may have been associated with this feature (see section 3.5 below).


3.0 Storm Data


3.1 Barometric Pressure


Station Station Latitude (ºN) LoPres (" Hg) LoPres (hPa) Hour (PST) Day (PST)

Coast
KACV 40.98 29.21 989.2 0400 11
KCEC 41.78 29.13 986.4 0400 11
KOTH 43.42 29.07 984.4 0500 11
KONP 44.61 29.01 982.5 0500 11
KAST 46.16 28.99 981.7 1300 11
KHQM 46.97 29.03 983.0 1400 11
KUIL 47.94 28.99 981.8 1800 11
TTIW1 48.39 29.00 982.0 1700 11
CWEB 49.38 29.07 984.4 1700 11
CWRU 50.12 29.12 986.0 1800 11
Interior
KRBL 40.15 29.43 996.7 0700 11
KMHS 41.32 29.43 996.7 0800 11
KMFR 42.38 29.18 988.2 0500 11
KRBG 43.23 29.10 985.4 0500 11
KEUG 44.13 29.11 985.8 0600 11
KSLE 44.91 29.10 985.6 1300 11
KPDX 45.60 29.13 986.4 0800 11
KOLM 46.97 29.11 985.8 1600 11
KSEA 47.44 29.16 987.6 1600 11
KNUW 48.35 29.13 986.6 1700 11
KBLI 48.64 29.16 987.6 1800 11
CYYJ 48.80 29.10 985.3 2000 11
CYVR 49.03 29.15 987.0 1800 11
CYXX 49.18 29.18 988.2 1800 11
CYQQ 49.72 29.18 988.1 1700 11
CYZT 50.68 29.19 988.6 1500 11
     
Average 29.13 986.6
Coast Avg 29.06 984.1
Interior Avg 29.18 988.1
11-Sta Avg   29.11 985.8    


Table 3.1 above Minimum sea-level pressure for 26 stations in the study region, timing and averages. The 11-station average uses ACV, OTH, AST, UIL, MFR, EUG, SLE, PDX, OLM, SEA and BLI.


Minimum pressures for the December 11, 2014 windstorm (Table 3.1) are roughly comparable to the major and much deeper November 14, 1981 extratropical cyclone. This is in part because the 2014 weather system tracked closer to the coast than the intense storm of '81.


Figure 3.1 above Coastal sea-level pressure trends (hPa) during the December 11, 2014 windstorm. Southern stations are shaded in orange, with northern in blue.


Figure 3.2 above Interior sea-level pressure trends (hPa) during the December 11, 2014 windstorm. Southern stations are shaded in orange, with northern in blue.


Sea-level pressure trends (Figures 3.1 and 3.2) show a classic progression with minimums being reached at southern stations first and northern stations last. A pronounced double-dip structure is present especially for Oregon locations, the first dip being associated with the passage of the leading cold/occluded front. Rapid pressure rises occurred at those sites that had close passage of the low center, most evident at the coastal stations Hoquiam (KHQM), Quillayute (KUIL) and Tatoosh Island (TTIW1). The broad, bowl-like form of the traces indicate an extratropical cyclone that is not progressing particularly fast, and also one that began weakening well before reaching its landfall location in the vicinity of Tatoosh Island.


Figure 3.3 above Coastal sea-level pressure cross-sections (hPa) during the December 11, 2014 windstorm. Stations are arranged by latitude. Earlier times (PST) have lighter shades.


Figure 3.4 above Interior sea-level pressure cross-sections (hPa) during the December 11, 2014 windstorm. Stations are arranged by latitude. Earlier times (PST) have lighter shades.


Pressure cross-sections (Figures 5 and 6) reveal an extratropical cyclone tracking from north to south that has, in typical fashion, the strongest pressure gradients to the south of the center. Keep in mind that these cross-sections do not cut through the low center until it is landing--the 2100 PST trendline is closest to landfall. Also, there is some noise because stations are not necessarily aligned perfectly south-to-north. Due to the path that the storm followed, most of the cross-sections depict a slice of the low to the east of the center. The coast, nearest the low center, had the steepest gradients. At 1500 PST on the 11th, the storm center neared Astoria and by 1800 PST, closed in on Tatoosh Island, carrying the strongest gradient northward just behind the low.


3.2 Pressure Tendencies


Station Max Hourly Fall (hPa) Hour (PST) Day (PST) Max Hourly Rise (hPa) Time (PST) Day (PST) Sepa-ration (hr)

Coast
KACV -2.5 2300 10 1.8 1000 12 11
KCEC -3.7 0100 11 1.9 1500 10 14
KOTH -3.4 0200 11 2.4 1400 10 12
KONP -5.1 0400 11 3.8 1500 11 11
KAST -3.3 0300 11 3.6 2000 11 17
KHQM -3.2 0400 11 4.9 2100 11 17
KUIL -2.6 0700 11 4.5 2200 11 15
TTIW1 -2.6 0600 11 8.1 2300 11 17
CWEB -1.4 1100 11 2.5 0200 12 15
CWRU -1.1 1200 11 2.2 0300 12 15
Interior
KRBL -2.1 0000 11 1.4 0800 12 32
KMHS -2.9 0000 11 2.3 1500 11 15
KMFR -3.0 0400 11 2.1 1500 11 11
KRBG -3.0 0200 11 2.5 1600 11 14
KEUG -4.0 0400 11 2.8 1700 11 13
KSLE -3.5 0500 11 3.2 1600 11 11
KPDX -3.6 0600 11 2.7 2100 11 15
KOLM -3.9 0400 11 3.2 2200 11 18
KSEA -3.4 0400 11 3.0 2100 11 17
KNUW -2.3 0800 11 2.9 0000 12 16
KBLI -2.6 0500 11 3.7 0000 12 19
CYYJ -2.5 0900 11 3.0 2300 11 14
CYVR -2.4 0700 11 3.1 0300 12 20
CYXX -2.3 0500 11 3.2 0100 12 20
CYQQ -1.6 0700 11 2.5 0400 12 21
CYZT -1.3 1200 11 2.1 0300 12 15
     
Average -2.8 3.1
Coast Avg -2.9 3.6
Interior Avg -2.8 2.7
11-Sta Avg -3.3 3.0


Table 3.2 above Maximum one hour pressure tendencies for 26 stations in the study region. Separation is the number of hours between the maximum rate of fall and maximum rate of rise.


Figure 3.5 above Hourly pressure tendencies at coastal stations for the December 11, 2014 windstorm. Southern stations are shaded in orange, with northern in blue.


Figure 3.6 above Hourly pressure tendencies at interior stations for the December 11, 2014 windstorm. Southern stations are shaded in orange, with northern in blue.


Overall, pressure tendencies were in a typical range for windstorms (Table 3.2). Storm averages were a little faster than the January 16, 2000 classic windstorm and on par to slower than the major November 14, 1981 event. Tendencies were generally the strongest on the coast where the low-pressure center tracked the closest. The rapid rate of fall at Newport (KONP) is in a rarefied category--the cold front likely contributed to this intense pressure drop. Tatoosh Island (TTIW1) experienced a strong pressure surge as the low tracked nearly right over the station. Values above +7.5 hPa/hr are quite rare and are almost always associated with the passage of a strong bent-back front, as was the case at Tatoosh during the December 11, 2014 windstorm. The pressure tendency trendline for Tatoosh shows a spike that stands out above all the other locations (Figure 3.5), the clear signal of a bent-back front. The interior stations generally had similar pressure tendencies, with no stations showing an intense surge like Tatoosh (Figure 3.6). The bent-back front weakened as the extratropical cyclone moved inland, which likely lessened the impact at inland locations. Such weakening is a common outcome, but sometimes landfalling lows bring inland strong bent-back fronts, such as February 7, 2002 and the 2006 Hanukkah Eve Storm.

Intense and fast-moving extratropical cyclones, two ingredients for high winds, tend to produce narrow separations between the peak rates of pressure fall and rise. The December 11, 2014 windstorm had some wide values even at locations close to the landfall point, largely a reflection of a slow moving storm, but also one that underwent its most rapid deepening well offshore.


3.3 Standard (1-Dimensional) Pressure Gradients


Station Pair Midpoint Latitude (º) Distance (km) Bearing N-S or W-E (º) Max Pressure Gradient (hPa) Max Pressure Gradient (hPa/100 km) Time (PST) Day (PST)

South-North
Coast (Short)
ACV-CEC 41.38 89.8 173 3.5 3.9 0600 11
CEC-OTH 42.60 182.0 180 7.1 3.9 1100 11
OTH-NWP 44.01 133.5 186 3.5 2.6 1300 11
NWP-AST 45.38 172.6 185 12.3 7.1 1700 11
AST-HQM 46.56 90.6 179 6.2 6.8 2000 11
HQM-UIL 47.45 117.6 156 9.2 7.8 2100 11
UIL-TTI 48.16 52.2 165 3.5 6.7 2200 11
TTI-WEB 48.89 172.4 131 -4.9 -2.8 2100 11
WEB-WRU 49.75 128.6 130 -2.0 -1.6 1900 11
Coast (Medium)
ACV-OTH 42.20 271.4 177 9.8 3.6 1100 11
OTH-AST 44.79 306.1 185 13.4 4.4 1600 11
AST-UIL 47.05 204.4 166 13.6 6.7 2100 11
UIL-WEB 48.66 217.5 138 4.8 2.2 0100 12
Coast (Long)
ACV-AST 43.57 576.2 182 16.8 2.9 1600 11
AST-WEB 45.18 410.4 152 11.0 2.7 2100 11
ACV-HQM 43.97 666.6 181 16.8 2.5 1700 11
HQM-WRU 48.54 457.7 141 8.4 1.8 0000 12
OTH-UIL 45.68 503.3 177 20.2 4.0 2000 11
ACV-UIL 44.46 774.7 178 20.5 2.6 1900 11
Interior (Short)
RBL-MHS 40.73 129.7 178 3.1 2.4 1200 11
MHS-MFR 41.85 127.1 159 9.4 7.4 0500 11
MFR-RBG 42.81 102.7 158 3.8 3.7 0700 11
RBG-EUG 43.68 100.7 186 3.7 3.7 1400 11
EUG-SLE 44.52 87.9 191 3.7 4.2 1400 11
SLE-PDX 45.25 82.3 201 -3.2 -3.9 0500 11
PDX-OLM 46.28 154.8 172 7.1 4.6 1900 11
OLM-SEA 47.21 68.8 220 -2.5 -3.6 0400 11
SEA-NUW 47.90 103.7 166 6.7 6.5 2300 11
NUW-BLI 48.50 50.7 189 -2.5 -4.9 1300 11
BLI-YVR 48.84 62.5 133 3.3 5.3 0200 12
YVR-YQQ 49.38 138.6 116 3.5 2.5 0300 12
YQQ-YZT 50.20 205.8 122 -2.3 -1.1 0000 12
Interior (Medium)
RBL-MFR 41.27 253.4 168 9.6 3.8 0500 11
MFR-EUG 43.26 196.8 172 5.2 2.6 1200 11
EUG-PDX 44.41 169.5 196 6.5 3.8 1700 11
PDX-SEA 46.52 206.8 186 -6.8 -3.3 0600 11
SEA-BLI 48.04 151.5 174 8.8 5.8 2300 11
BLI-YQQ 49.18 199.3 122 6.0 3.0 0200 12
Interior (Long)
RBL-EUG 42.14 449.9 170 12.5 2.8 1200 11
EUG-OLM 45.55 316.7 184 11.9 3.8 1800 11
OLM-BLI 47.81 204.8 187 8.7 4.2 2300 11
BLI-YZT 49.66 405.0 123 4.8 1.2 0200 12
West-East
ACV-RBL 40.56 181.8 120 -11.6 -6.4 0200 11
OTH-RBG 43.33 75.1 105 -3.0 -4.0 1100 11
NWP-SLE 44.76 91.1 68 -7.5 -8.2 0400 11
AST-DLS 45.89 218.5 105 -9.2 -4.2 0800 11
PDX-DLS 45.61 112.2 88 -7.5 -6.7 0600 11
HQM-OLM 46.97 77.1 89 -4.2 -5.4 1400 11
UIL-BLI 48.29 177.0 56 -7.3 -4.1 1300 11
BLI-YHE 49.00 99.6 50 -5.8 -5.8 1800 11
YVR-YHE 49.20 123.8 80 -6.4 -5.2 1800 11
WEB-YQQ 49.55 124.7 72 -4.1 -3.3 1600 11


Table 3.3 above For a selection of the many possible station pair combinations in the study region, standard (or one-dimensional) pressure gradients. Station-pair latitude (º), distance (km) and bearing (º) are provided. The raw peak gradient magnitude in hPa is shown along with the same value scaled to hPa/100 km. Scaling the gradients to a standard measure provides more consistent intercomparison between regions. Times and dates are in PST.


Figure 3.6 above Coastal scaled pressure gradients (hPa/100 km) for medium-distance station separations. Southern station pairs are shaded in orange, with northern in blue.


Figure 3.7 above Interior scaled pressure gradients (hPa/100 km) for medium-distance station separations. Southern station pairs are shaded in orange, with northern in blue.


Figure 3.8 above Intercomparison of coastal and interior scaled pressure gradients (hPa/100 km) for medium-distance station separations, with locations arranged by latitude. Depicted are the peak absolute values, therefore negative gradients are shown as positive (not to be confused with the absolute, or 2-D, pressure gradients discussed in section 3.4 below). The coast is shown in black, interior gray.


In general, the standard 1-D pressure gradients for the December 11, 2014 windstorm were strong but not near record territory (Table 3.3). The highest values in standard fashion tended to be along the coast for those regions that ended up in the southeast quadrant of the extratropical cyclone. Among the south-north measures and especially for the interior locations, negative values, indicating gradients with a northerly component to their pressure slope (likely northeast), tended to be stronger at a larger number of locations than is typical. This suggests a northeast quadrant with gradients somewhat more intense than the southeast quadrant, and may be indicative of the storm running into relatively strong high pressure over the intermountain region to the east.

There is a nice progression of ever strengthening pressure gradients from south to north along the coast (Figure 3.6). The Washington coast experienced the strongest gradients, not surprising given the track of the low almost over Tatoosh Island. The interior stations show a similar progression, but more weakly, with the highest values over the Northwest Interior of Washington (Figure 3.7). Broadly speaking, coastal locations had higher values than the interior, in part a result of the closer proximity of the low to the coast (Figure 3.8), though pressure slope interacting with the orientation of the station-pairs confounds interpretation.

More detailed discussion of pressure gradients using 2D measures is in section 3.4, below.


3.4 Absolute (2-Dimensional) Pressure Gradients

Location Station Triad Mean Latitude (ºN) Max Pres Grad (hPa [100] km-1) Pres Slope (º) Peak Mg (mph) Est Peak  2-Min Wind (mph) Est Peak  3-Sec Gust (mph) Time (PST) Day (PST) Month (PST)
Coast
Northwest California UKI-RBL-CEC 40.35 6.9 102 133 45 70 0200 11 12
South Oregon CEC-OTH-RBG 42.81 5.0 142 92 35 55 1100 11 12
North Oregon OTH-AST-PDX 45.05 5.8 144 103 35 55 1600 11 12
South Washington AST-HQM-OLM 46.70 7.5 156 129 40 65 2000 11 12
North Washington HQM-TTI-WSP 47.91 11.1 114 184 50 75 2300 11 12
South Vancouver Island TTI-WEB-YQQ 49.16 5.4 10 89 35 55 0800 11 12
Central Vancouver Island WEB-WRU-YZT 50.06 4.2 67 68 30 50 0500 11 12
North Vancouver Island WRU-46207-YZT 50.56 4.8 351 75 30 50 1800 11 12
Interior
Northwest California RBL-LMT-MFR 41.56 6.6 111 124 40 65 0600 11 12
Southwest Oregon MFR-EUG-BDN 43.54 5.5 83 100 35 55 0400 11 12
Northwest Oregon EUG-PDX-AST 45.30 5.7 137 100 35 55 1600 11 12
Willamette Valley EUG-HIO-TTD 45.08 5.3 156 94 35 55 1700 11 12
Southwest Washington PDX-OLM-TCM 46.57 6.9 121 120 40 65 1900 11 12
Puget Lowlands TCM-PAE-CLM 47.73 8.8 175 148 45 70 2300 11 12
Northwest Washington PAE-CLM-YVR 48.41 8.6 77 145 45 70 2000 11 12
Puget Trough OLM-YYJ-YHE 48.51 6.0 122 100 35 55 2200 11 12
South Georgia Strait YYJ-YVR-YXX 48.95 5.8 130 96 35 55 0200 12 12
Georgia Strait YYJ-YQQ-WSK 49.38 3.8 21 63 30 50 2000 11 12


Table 3.4 above For 18 pressure-wind triangles located in the study region, peak absolute pressure (or 2-D) gradient (hPa/100 km), associated pressure slope (º), geostrophic potential wind (Mg in mph) and estimated peak surface wind and gust (mph) for overland regions based on the gradient magnitude and the presence of turbulent drag from surface roughness.


Figure 3.9 above Absolute (2-D) pressure gradients (hPa/100 km) for coastal regions. Trendlines from southern pressure-wind triangles are shaded in orange, with northern in blue.


Figure 3.10 above Absolute (2-D) pressure gradients (hPa/100 km) for interior regions. Trendlines from southern pressure-wind triangles are shaded in orange, with northern in blue.


Figure 3.11 above Intercomparison of the peak absolute pressure (or 2-D) gradient (hPa/100 km) for coastal (black) and interior (gray) locations arranged by mean latitude.


For intercomparison between storms and regions, absolute pressure gradients (Table 3.4) are more ideal than the traditional 1-D measures because the pressure slopes differ between events and therefore affect 1-D magnitudes, and absolute pressure gradients are reported with a standard unit of measure (here it is the difference in hPa over 100 km).

Peak absolute pressure gradients in some regions reached very intense levels, such as the 11.1 hPa/100 km value for the north Washington coast. Gradient magnitudes of 4-6 are strong and can support high winds. Values in the range of 7-9 hPa/100 km are intense and very supportive of high winds. Anything in the double digits, especially in the interior, is extreme. For comparison, pressure gradients for some historic extratropical cyclones, including the 1962 Columbus Day Storm, have peaked in the 12-18 hPa/100 km range. During the December 11, 2014 windstorm, the Washington coast and interior received the strongest gradients, largely due to the low tracking closer to this region than places south. Places that ended up on the left (~northwest) side of the low, such as the central and north coasts of Vancouver Island, tended to have the weakest peak gradients. Interestingly, the maximum gradient in the Willamette Valley, 5.3 hPa/100 km, while strong fell short of regions to the north--yet some of the strongest interior lowland winds occurred in this region.

As noted in section 3.3, pressure gradients became more intense from south to north as the storm progressed, with some exceptions (Figures 3.9 and 3.10). Due to the path that the low followed, Washington, and parts of extreme southwest British Columbia, experienced the highest values. Interesting details in the trendlines include the most intense gradients on the coast being short-lived, reflected in the sharp spikes. High pressure over the desert southwest apparently supported relatively strong gradients, early in the storm, over northwest California and southwest Oregon. The Puget Lowlands had a relatively long period of strong gradient--compare to the Northwest Interior--that may be indicative of the development of an Olympic Mountain lee low, which are known to prolong high winds in the area when they occur (Steenburgh and Mass 1996). The classic case of a lee-low enhancing Puget Lowland winds occurred during the February 13, 1979 windstorm (Reed 1980). The South Georgia Strait and Georgia Strait regions had double peaks, the latter likely being related to the passage of the bent-back front--this despite obvious weakening as the front moved inland. A second surge of strong wind associated with the increase in pressure gradient swept the area in the early morning of the December 12th.

Peak pressure gradient magnitudes on the coast and interior followed each other fairly closely, save for over northwest Washington (Figure 3.11). This is in contrast to the 1-D measurements (Figure 3.8), a difference that likely has something to do with the geometry--the pressure slope interaction with the bearing between the two stations used in the 1-D measures causing a greater tendency for lower readings at interior stations where there is stronger deviation from due N-S at some locations. Returning to the 2-D gradients in Figure 3.11, the sharper difference in magnitude between the coast and interior in northwest Washington is likely a reflection of the low's close passage to the North Washington Coast pressure-wind triangle, bringing steeper gradients associated with a compact core over the coast. The extratropical cyclone clearly had a funnel-shaped pressure profile at the time of landfall, at least on the south side of the system. The profile is evident in the pressure cross-sections (Figure 3.3), and explains the higher gradients in Washington verses places south.

In a fashion typical of classic-path windstorms, peak pressure gradients had a southeasterly pressure slope (~120-150º) in many locations. For those regions with a north-south geography that forces southerly ageostrophic winds, such as the Willamette Valley, the southeasterly pressure slope during maximum gradient likely reduces peak wind speeds to a degree. The Puget Lowlands, with a 175º pressure slope during an intense 8.8 hPa/100 km peak gradient, had a nearly ideal situation for high winds. Interestingly, places to the south and north of the Puget Sound generally had higher gusts. Due to a terrain orientation that is largely northwest to southeast, easterly pressure slopes (~70-110º) are supportive of southeasterly winds in the Northwest Washington Interior and the Georgia Strait, and a southeasterly pressure slope is an ideal alignment for ageostrophic winds.

Despite the maximum gradients occurring in Washington, some of the strongest winds struck Oregon (Figure 1.1). Note especially the low peak gusts at Bremerton (KPWT) and Shelton (KSHN). Likely, an important contributor to the stronger winds in the Willamette Valley came from ideal upper support, discussed in more detail in the synoptic analysis (section 2.2 above). Also the pressure gradient reached an intense 6.9 hPa/100 km in the Southwest Washington Interior. This suggests that the pressure gradient over the north end of the Willamette Valley, where the highest wind gusts occurred, was perhaps higher than for the overall Willamette area. Perhaps a blend of the two regions captures the peak gradient over Portland Metro better: ~6.1 hPa/100 km (equivalent to 10.3 hPa over the EUG-PDX distance). The pocket of high-wind criteria gusts in Washington's Northwest Interior and also in the southern Georgia Strait appear to have been supported largely by the intense pressure gradient associated with the close passage of the low combined with a relatively good orientation for SE winds. The Puget Lowlands had a good setup for strong winds both in pressure gradient magnitude and orientation, but the potential appears not to have been realized to the same extent as in the Willamette Valley and Northwest Interior. Some of this may have to do with weaker upper support over the Puget Sound compared to the Willamette Valley, but this does not explain the higher winds in the Northwest Interior. There does appear to be a tendency for slower winds, relative to the surrounding regions, in the Puget Lowlands during classic-path windstorms and this suggests that geography may be playing a role in a not so obvious manner. The Northwest Interior has wider channels than the narrow Puget Sound, which due to lower surface friction (reduced turbulent drag) over the water may be contributing to higher wind readings, but this is probably only a piece of the story.


3.5 Peak Wind and Gust


Location Latitude (ºN) Peak Wind (2-min) Peak Gust (3 or 5-sec)
Direct (°) Speed (kt) Speed (mph) Speed (km/h) Time (PST) Day (PST) Direct (°) Speed (kt) Speed (mph) Speed (km/h) Time (PST) Day (PST)

Coast
KACV 40.98 190 23 26 43 0433 11 230 40 46 74 0624 11
KCEC 41.78 190 37 43 69 0556 11 190 59 68 109 0559 11
KOTH 43.42 200 27 31 50 1335 11 200 42 48 78 1315 11
KONP 44.58 210 33 38 61 1535 11 170 52 60 96 1355 11
KAST 46.16 180 34 39 63 1655 11 190 49 56 91 1735 11
KHQM 46.97 200 38 44 70 2017 11 200 49 56 91 2018 11
KUIL 47.94 240 24 28 44 2138 11 220 37 43 69 2215 11
46087 48.49 277 37 43 69 2320 11 277 46 53 86 2317 11
CWEB 49.38 270 16 18 30 0400 12 270 22 25 41 0402 12
Coast Max 277 38 44 70 277 59 68 109
Coast Min 180 16 18 30 170 22 25 41
AGR
Coast Avg 213 29.9 34.4 55.4 209 44.1 50.7 81.6 1.47
 
Interior
KRBL 40.15 160 33 38 61 0554 11 150 47 54 87 0600 11
KMFR 42.38 140 19 22 35 0253 11 160 44 51 81 0559 11
KRBG 43.23 170 21 24 39 1153 11 170 28 32 52 1137 11
KEUG 44.13 200 33 38 61 1354 11 180 47 54 87 1357 11
KSLE 44.91 190 28 32 52 1456 11 190 46 53 85 1510 11
KPDX 45.60 200 32 37 59 1753 11 200 58 67 107 1723 11
KKLS 46.12 170 29 33 54 1615 11 160 43 49 80 1635 11
KOLM 46.97 170 26 30 48 1754 11 180 48 55 89 1752 11
KSEA 47.44 180 30 35 56 2153 11 180 43 49 80 2157 11
KNUW 48.35 140 36 41 67 2227 11 150 60 69 111 2021 11
KBLI 48.80 140 33 38 61 2153 11 150 51 59 94 2234 11
CYYJ 48.64 200 26 30 48 0100 12 200 37 43 69 0100 12
CYVR 49.03 150 27 31 50 0100 12 150 43 49 80 0100 12
CYXX 49.18 170 31 36 57 0000 12 140 49 56 91 2221 11
CYQQ 49.72 150 17 20 31 0600 11 150 24 28 44 0600 11
Interior Max 200 36 41 67 200 60 69 111
Interior Min 140 17 20 31 140 24 28 44
AGR
Interior Avg 169 28.1 32.3 52.0 167 44.5 51.2 82.5 1.59
Coast/Interior Avgs 1.26 1.07 1.25 0.99
24-Sta Max 277 38 44 70 277 60 69 111
24-Sta Min 140 16 18 30 140 22 25 41
AGR
11-Sta Avg 193 28.2 32.4 52.2 191 43.2 49.7 80.0 1.53
24-Sta Avg 186 28.7 33.0 53.1     183 44.1 50.7 81.6 1.54  


Peak Wind/Gust Table Notes
Peak wind as reported in the hourly and special observations, to keep consistency with earlier records.
Wind is a 2-minute average for all listed stations, save for some NDBC platforms.
Gust for US stations is a 3-second (s) average, save TTIW1/46087 which is a 5-s average. Canadian gust is 3-s.
YVR and YXX peak gust from the daily data. Timing and direction based on peak in the hourly and special obs.
Buoy 46087 is used in place of TTIW1 as the latter stopped reporting wind in early 2014.

Table 3.5 above For 24 key stations in the study region, peak wind and gust (knots, mph and km/h), with direction (º) and time of occurrence (PST). Regional and overall maximums, minimums and averages are provided, along with the legacy 11-station average. Average gust ratios (average wind/average gust), or AGR, are also included. Wind direction average is based on vector components.


Figure 3.12 above Peak wind (mph), peak gust and peak wind direction (º) for coastal stations arranged by latitude.


Figure 3.13 above Peak wind (mph), peak gust and peak wind direction (º) for interior stations arranged by latitude.


Figure 3.14 above Peak wind (mph) and peak wind direction (º) for coastal and interior stations arranged by latitude.


Peak wind and gust for the December 11, 2014 shows notable similarity between the coast and interior (Table 3.5, Figures 3.12-3.14). Indeed for some locations at similar latitudes, the interior had higher speeds (e.g. Portland vs. Astoria). Such an outcome is not unprecedented (e.g. April 14, 1957), and in fact a pattern where coastal and interior peak wind speeds are roughly comparable--or interior speeds are higher--is evident in a number of past classic-path windstorm events. This is interesting given that coastal locations more typically, being in close proximity to a large body of open water, tend to have higher wind speeds than the interior during routine storms and other types of windstorm scenarios (e.g. extratropical cyclones with northeast to east tracks). For a like pressure gradient--and during the 2014 storm pressure gradients were similar between the coast and interior save for in parts of Washington (Figure 3.11)--one might anticipate higher surface winds at coastal locations due to lower turbulent drag over the water resulting in faster speeds. The overwater momentum can be carried inland, though it is reduced fairly rapidly. One example of this is at Vancouver, BC, where a westerly wind blowing inland off of the Georgia Strait can have its speed cut in half over just a few km as the airflow encounters higher drag forces overland.

During southerly windstorms on the Oregon and Washington coast, things are complicated as the wind is roughly parallel to the shoreline and the potential overwater speed boost is likely reduced save for at exposed headlands and places very close to shore. However, given the tendency for a southeasterly pressure slope as the low passes to the north of a given region, and the tendency for wind direction over the water to be nearly parallel with the isobars--turned toward the low by a few degrees--there is the tendency for a modest westerly component to the wind direction during classic windstorms along the coast. For example, the peak wind directions at nearly all the coastal stations during the December 11, 2014 windstorm were from the SSW to SW. These wind directions are favorable for bringing some over-water momentum inland to coastal communities.

Other factors that favor higher speeds at the coast, especially during classic windstorms, include a closer proximity to the low-pressure center that usually results in higher pressure gradients. In the case of 2014, being nearer the low did not necessarily translate into steeper gradients, pointing to part of the reason for the relatively slow winds on parts of the Pacific shore. A coastal low-level jet can also develop under the right circumstances, which may boost local wind speeds depending on a number of factors. It appears that this phenomenon did not take on a strong form during the 2014 windstorm--but this is outside the scope of the current analysis.

One important reason for the pattern of roughly comparable winds between the coast and interior is the already discussed good upper support for high winds over the Willamette Valley (Section 2.2). By the time the low-pressure center reached a position to deliver strong southerly winds to Oregon's north coast, the best upper support had shifted inland, over the Willamette Valley. This probably boosted wind speeds in the Valley, especially in the Portland Metro area, relative to the coast where upper winds were slower.

The average peak wind and gust speeds for the December 11, 2014 windstorm (Table 3.5) were below the 33.4 mph and 52.5 mph averages for the January 16, 2000 classic windstorm. Given a track closer to the coast, and an apparently deeper minimum central pressure (974 hPa in 2014 vs. 980 hPa in 2000), the slower peak winds for the 2014 storm are interesting. Consider also the fact that the 2000 windstorm had the relatively slow pace of 24 mph (38 km/h), even slower than the 29 mph (46 km/h) speed of the December 11, 2014 extratropical cyclone (section 2.1 above). Though the two events appear to have had relatively similar upper-level wind setups, the 2014 windstorm almost certainly had an edge over the 2000 storm, with close to an ideal arrangement over parts of western Oregon. By all accounts, the 2014 windstorm should have outperformed the event from 2000. Then, add in the fact that many of the wind measurements in 2014 were on new very sensitive sonic anemometers that do not have inertial response considerations and gusts are determined with a 3-second moving average. In 2000, reported gusts were a 5-second block average on cup-based anemometers. These differences in instrumentation and methodology make the lower peak winds in 2014 even more remarkable. It appears that there are still some mysteries to be solved with regard to Pacific Northwest windstorms, though it is important to recognize that the two windstorms being compared here are close in magnitude which means that noise is potentially a confounder to interpretation. The broad patterns described here (e.g. the influence of central pressure and track location on peak wind speeds), when applied over a wider range of events including the major storms, stand out more clearly.

A few select regions did experience faster winds during the December 11, 2014 windstorm. The Portland Metro area appears to have had the strongest winds since the December 12, 1995 windstorm. Given the differences in the peak gust measurement methodology between storms, it is perhaps better to consider the maximum 2-min wind speed when comparing events. For Portland (KPDX), the 2014 storm produced a faster peak wind than the 2000 event, but not as strong as the peak in 1995.


Storm Peak 2-min Wind (mph) Peak 2-min Wind (km/h) Direction (º)

12 Dec 1995 51 81 170
16 Jan 2000 43 69 180
11 Dec 2014 47 76 190


Table 3.6 above Peak 2-minute wind at Portland (KPDX) for the three most recent classic-path windstorms. The maximums are from the daily data, which captures the highest wind speed during the day. These speeds may not match those listed in the standard peak wind table (e.g. Table 3.5), since the numbers in the standard table are obtained from the hourly and special observations.


The Portland Metro area is one of the few regions where the December 11, 2014 extratropical cyclone outperformed the January 16, 2000 storm. Parts of the southwest Oregon coast also appear to have had stronger winds (Figure 1.1). But for the coastlines of central and north Oregon also much of Washington, the storm in 2000 generally produced stronger gusts, and this with 5-second averages employed. The Washington interior also had generally stronger gusts in 2000, though around Whidbey Island the winds may have been a little slower.


4.0 Additional Storm-Related Data


4.1 Meteograms and Maps


Figure 4.1 above Hourly 2-minute wind compared to hourly precipitation at Portland (KPDX), Seattle (KSEA) and Vancouver (CYVR). CWMM, or Pitt Meadows, is used in place of CYVR for precipitation because CYVR appears to report only 6-hourly totals.


Temperature and dew point in relation to the timing of peak winds and the idea of vertical mixing causing dew point depression are discussed above (Section 2.2, Figure 2.5). In this section, other weather variables will be examined for the key population centers of the region.

The main precipitation with this storm occurred well ahead of the peak winds (Figure 4.1), and is clearly associated with the leading front. Totals were not very high, ranging from 0.15" (3.8 mm) at Portland to 0.37" (9.4 mm) at Pitt Meadows. According to the weather lore of the Pacific Northwest, windstorms tend to be relatively "dry", and the December 11, 2014 event fits the mold. However, some recent windstorms have brought with them intense precipitation, including the 2006 Hanukkah Eve Storm and the 2007 Great Coastal Gale, and thus one should not expect every windstorm to produce little precipitation.

Also, the December 11, 2014 windstorm brought a deluge to northern California. The extratropical cyclone left a long trailing front, in essence an atmospheric river, draped across much of the state. For example, San Francisco (KSFO) had heavy rain with 0.37" (9.4 mm) in the hour ending 08:56 on December 11th. Given the strong meridional jet stream, the front slowly progressed southeast, followed by the development of a secondary wave that caused the baroclinic band to lift northward again as a pseudo-warm front (NCDC 2014), bringing another round of intense rain to northern California. The protracted rain in the Bay Area resulted in a storm total of 3.57" (90.7 mm) at San Francisco. This is a lowland station--higher elevation locations, and places north received two to three times as much (Figure 4.2). Indeed some locations reported hourly rain totals of two to three inches (50-75 mm). The storm ameliorated a historic drought underway in the region, but only temporarily as this was essentially a one-day rain event right in the middle of a remarkable multi-year dry period--reminiscent of desert thunderstorms that drop inches of rain between months of arid conditions.


Figure 4.2 above Northern California 36-h precipitation (inches) for the December 11, 2014 windstorm. Map courtesy of the National Weather Service. Hat-tip to Charlie Phillips for finding this map.


Heavy rains also occurred in California during great 1962 Columbus Day Storm. Indeed, this appears to be a general pattern among classic-path windstorms: California tends to get the heaviest rainfall and locations north tend to get the highest wind. The strong meridional pattern during classic windstorms appears to favor heavy rain in California because the coastline, and associated mountains, jut southeast to northwest. South to southwest upper air flow runs nearly perpendicular to the terrain axis, forcing copious rainfall. Also, the already mentioned tendency for frontal systems associated with deep upper troughs to have a slow progression eastward likely contributes.

In San Francisco on December 11, 2014, wind gusts to 48 mph (78 km/h) lashed the heavy rain and the combination caused widespread disruption of transportation and electrical systems. This earned the tempest the moniker #Hellastorm, apparently the first classic-path windstorm in history to get a hash tag for a name.

Returning to the Pacific Northwest, for the north-south trending valleys, the onset of strong winds with classic windstorms are often very closely tied with passage of the low-pressure center just north. In essence, as the pressure slope shifts from easterly to southeasterly, i.e. going from unsupported to supportive of southerly ageostrophic winds, the surface wind shifts from the northeast quadrant (E to ESE at KPDX due to the Columbia Gorge gap winds) to the southerly quadrant and accelerates fairly rapidly--sometimes it is like a switch has been thrown. Portland (KPDX) most clearly shows this pattern (Figure 4.3), with wind speeds accelerating right after the second barometric pressure minimum, which marks the time that the low has moved north of the station latitude.


Figure 4.3 above Hourly 2-minute wind and 3-second gust (mph) at Portland (KPDX), Seattle (KSEA) and Vancouver (CYVR) compared to sea-level pressure (hPa). Gust is not reported during most observations as there is an algorithm that prevents gust records if the separation between wind and gust is below a specific value. In these cases, gust is estimated using a sliding gust factor based on reported wind speed. The gust values during the main wind surge at each station were recorded--they met the criteria--and therefore these are not estimated.


At Seattle (KSEA) and Vancouver (CYVR), the pattern is not so clear, mainly because there is an interesting delay between low pressure and the onset of the main wind surge (Figure 4.3). The delay may be due in part to the low weakening as it moved up the coast, resulting in a slowly rising pressure before the cyclone center reached the latitude of Seattle.

Regional pressure slopes provide a stronger picture of the relationship between low position and the onset of the main wind surge (Figure 4.4). During weak pressure gradients (e.g. <1.0 hPa/100 km), small difference in pressure due to local effects or measurement error can lead to large swings in pressure slope. Also, incoming frontal systems can also cause big short-period changes in the gradient orientation. These two factors explain the sharp jumps in pressure slope for some regions early in the storm period.

For Portland, the main winds did not arrive until the pressure slope has exceeded approximately 135º, or southeast. If the Willamette Valley is assumed to have a 180º orientation (for the sake of simplicity), then about 71% (cos 45º) of the pressure gradient's remaining potential could be realized after surface boundary-layer factors such as turbulent drag are taken into consideration.


Figure 4.4 above Hourly 2-minute wind for Portland (KPDX), Seattle (KSEA) and Vancouver (CYVR) compared to the hourly pressure slope (º) as determined using the Willamette Valley, Puget Lowlands and South Georgia Strait pressure-wind triangles.


At Seattle, the main winds started when the pressure slope reached approximately 110º, not as supportive of south winds as the 135º orientation at Portland, but still above 90º (Figure 4.4). When considering conditions in the Seattle area, it is important to keep in mind that troughing in the lee of the Olympics likely affected the pressure field around Port Angeles (KCLM). A mesoscale lee low is indicated in the numerical weather prediction model forecast just before the storm (Figure 4.5). Such lee troughing results in a tendency for more easterly pressure slopes when using the Puget Lowlands pressure-wind triangle, which uses Port Angeles pressure readings for one of its legs. Due to using Victoria (CYJJ) pressure data, the South Georgia Strait pressure gradient orientations are also likely influenced by the Olympic lee low in a similar manner, but generally not as strongly.


Figure 4.5 above WRF-GFS 4-km domain 12:00 UTC December 11, 2014 initialization. This is a forecast for sea-level pressure, wind and 925 hPa temperature (ºC) valid for 22:00 PST on December 11th (18 hr in the future). Position of the extratropical cyclone center and an associated Olympic Mountain lee low are indicated. NWP output courtesy of the University of Washington Department of Atmospheric Science.


During southeasterly windstorms, Vancouver (CYVR) tends to have a more gradual escalation of winds toward peak values than places like Portland or Seattle (Figure 4.4). This is largely due to Vancouver being situated in a geography that favors southeast winds, including its close proximity to the Georgia Strait, a large body of water relative to narrow channels like the Puget Sound. Pressure slopes from the east can support SE winds at Vancouver. Usually, the winds start out E (with a northeast pressure slope) and gradually migrate to SE as the storm approaches, becoming ever faster until the low center makes landfall, at which time peak winds tend to occur followed by a gradual decline. Looking at the data for the December 11, 2014 windstorm, the peak wind phase of the storm started after the pressure slope shifted from northeast (~45º) to nearly due east (~90º), with the wind continuing to blow at elevated speed as the gradient orientation quickly aligned nearly due southeast (~135º) over the next hour.

In summary, at all three stations, the pressure slope reached 90º or above before the onset of the peak wind phase, indicative of the low-pressure center having reached, or passed the station latitude.

Peak winds generally occurred at the time of maximum absolute pressure gradient at the three locations (Figure 4.6). This is what I call a "well-behaved" storm, with an apparent relationship between surface pressure gradient and wind speed. In the complex terrain of the Pacific Northwest, this does not always occur. Indeed, the relationship between pressure gradient and wind speed may be quite weak, depending on the situation.


Figure 4.6 above Hourly 2-minute wind at Portland (KPDX), Seattle (KSEA) and Vancouver (CYVR) compared to the hourly absolute pressure gradient (hPa/100 km) as determined using the Willamette Valley, Puget Lowlands and South Georgia Strait pressure-wind triangles.


The much stronger pressure gradient over the Puget Lowlands seen in Figure 4.6, nearly 9 hPa/100 km, is likely due to the influence of the abovementioned Olympic lee low. Very tight isobaric packing is evident south of the meso-low in Figure 4.5, covering part of the Puget Lowlands. Interestingly, lee troughing is thought to have the potential to prolong the strong wind phase over the Puget Sound (Steenburgh and Mass 1996), but in the case of the December 11, 2014 windstorm a protracted wind event did not occur. This despite six consecutive observations with a pressure gradient higher than what occurred over the Willamette Valley or South Georgia Strait. The tendency for a more easterly pressure slope may have mitigated the winds in Seattle somewhat. However, as noted earlier, the orientation shifted nearly due south during peak gradient, a very supportive alignment for south winds. There is a bit of a mystery here.

The South Georgia Strait shows a double peak in pressure gradient. As discussed earlier, the bent-back front appears to have had a noticeable influence on the weather conditions in the Vancouver Metro area. The second spike in pressure gradient is also probably associated with the bent-back front. Note how there is a modest escalation in wind speed, off of near-maximum values, associated with the second increase in pressure gradient.

The leading front sweeping inland ahead of the low caused an initial dip in sea-level pressure at the three stations Portland, Seattle and Vancouver (Figure 4.7). These pressure changes influenced local pressure slopes (Figure 4.4), which in turn caused the 2-minute wind direction to change dramatically over a short period of time (Figure 4.7). After the front moved through, and the pressure slopes realigned in response to the cyclonic curvature of the incoming extratropical cyclone center, winds resumed, roughly an initial offshore configuration, E to NE. The direction abruptly shifted to S and then SSW at Portland as the low passed the station latitude. The persistence of the southerly direction at Portland is likely a reflection of the close to ideal wind-tunnel like configuration of the Willamette Valley. Seattle experienced a more gradual alteration of direction, shifting through E to SE to S over a six hour period. The winds at Vancouver also underwent a more gradual change, following the fairly common pattern as discussed above, moving from E to SE and eventually SSE as the low center passed to the west on its north-northeast track.


Figure 4.7 above Hourly 2-minute wind direction (º) and sea-level pressure (hPa) at Portland (KPDX), Seattle (KSEA) and Vancouver (CYVR).


5.0 Summary and Conclusions


The December 11, 2014 windstorm had a classic path, i.e. strongly meridional, with the low tracking north-northeast just off the Pacific coast. In fact, the storm had a trajectory quite similar to the infamous Columbus Day Storm--the closest of any classic windstorm since 1962. The extratropical cyclone went through what might be considered a fairly typical progression of development for this type of storm, reaching peak intensity (Shapiro and Keyser Stage-III) while off the southwest Oregon coast and reaching maximum depth (while in Stage-IV) as the low moved over northwest Oregon waters.

Due to following a classic path, the storm brought strong winds from northern California into southwest British Columbia. However, overall peak wind speeds generally did not approach those of the major windstorms (e.g. the 1962 Columbus Day Storm, November 13-14, 1981 and December 12, 1995), being comparable to what might be considered middle-of-the-road classic windstorms such as January 16, 2000. The minimum central pressure, around 974 hPa, was above the rare 947-960 hPa range observed during key historical events. And the 2014 windstorm appears to have progressed more slowly than the major windstorms. These two characteristics probably are the main reasons for lower wind speeds relative to the major storms, though other factors likely also contributed.

Interestingly, compared to the January 16, 2000 windstorm, the December 11, 2014 storm had somewhat weaker overall peak winds. This is despite many characteristics in favor of higher winds for the 2014 storm, including: 1) track closer to the coast; 2) deeper central pressure; 3) faster northward migration; 4) better upper-level wind support including favorable jet-core positioning right over the region; and 5) wind speeds being measured on sonic anemometers, as opposed to cup-based sensors that have inertial response considerations, with a shorter averaging period for gust. These facts suggest that there is more waiting to be learned about Pacific Northwest Windstorms.


6.0 Supplemental Storm-Related Information


6.1 Storm Photos


Figure 6.1 above Southeasterly wind gusts on in the vicinity of Whidbey Island, WA, climbed to 60-70 mph (95-115 km/h) during the December 11, 2014 windstorm, causing damage to trees and property. In this scene, a large red alder succumbed to the gale, bringing down lines as it crashed across a byway. Photo by Charlie Phillips.


Figure 6.2 above A routine sight throughout the storm strike zone, fences in Sandy Hook on Whidbey Island, WA, were disrupted by the December 11, 2014 gale. Photo by Charlie Phillips.


Figure 6.3 above A Sandy Hook, Whidbey Island, boat shed lost a portion of its roof during the high winds. Photo by Charlie Phillips.


Figure 6.4 above Known as "salad" in some circles, conifer trees shed numerous small branches during the December 11, 2014 windstorm, nearly burying this Whidbey Island road. Photo by Charlie Phillips.


Figure 6.5 above As the December 11, 2014 extratropical cyclone landed on Vancouver Island, southeast wind gusts climbed to 50-55 mph (80-90 km/h) throughout much of the inland areas of Metro Vancouver, BC, with speeds reaching 60-65 mph (95-105 km/h) along the shores of the Georgia Strait. Enough to topple trees such as this plum in the Oakridge area. Power outages, mainly due to tree and branch failures, were widespread, with 78,000 customers affected (5.5% of the customer base) at peak according to BC Hydro.


Data Sources and Bibliography


Data Sources

Surface observations are from the National Climatic Data Center, the National Data Buoy Center and Environment Canada. Surface maps used for storm track determination are from the US. Weather Prediction Center. Upper-air analysis is based on maps from the US. National Center for Environmental Prediction. Satellite photos are from the US. National Weather Service. Upper-air sounding data are from the University of Wyoming Department of Atmospheric Science.

Peer-Reviewed References

Lynott, R. E. and O. P. Cramer, 1966: Detailed analysis of the 1962 Columbus Day windstorm in Oregon and Washington. Mon. Wea. Rev., 94, 105-117.

Mass, C. F. and B. Dotson, 2010: Major extratropical cyclones of the Northwest United States: Historical review, climatology and synoptic environment. Mon. Wea. Rev., 138, 2499-2527.

Reed, R. J., 1980: Destructive winds caused by an orographically induced mesoscale cyclone. Bull. Amer. Meteor. Soc., 61, 1346-1355.

Reed, R. J. and M. D. Albright, 1986: A case-study of explosive cyclogenesis in the eastern Pacific. Mon. Wea. Rev., 114, 2297-2319.

Shapiro, M. A. and D. Keyser, 1990: Fronts, jet streams, and the tropopause. Extratropical Cyclones, The Erik Palmén Memorial Volume, C. W. Newton and E. Holopainen, Eds., American Meteorology Society, 167-191.

Steenburgh, W. J. and C. F. Mass, 1996: Interaction of an intense extratropical cyclone with coastal orography. Mon. Wea. Rev., 124, 1329-1352.

Book References

Lange, O., 1998: The Wind Came All Ways. Environment Canada,122 pp.

Other References

BC Hydro, 2014: Power Outages List. Accessed December 12, 2014 at: https://www.bchydro.com/outages/orsTableView.jsp.

Fernandez, R., 2014: Thursday evening Portland-area commute: Powerful wind storm causing power outages, downed trees. The Oregonian/Oregon Live, December 11, 2014, 4 pp.

NCDC, 2014: Storm Data and Unusual Weather Phenomena, December 2014. National Climatic Data Center, 56, 157 pp.

Woolington, R., 2014: As winds ripped through Washington County, emergency dispatchers took 907 calls in 4 hours. The Oregonian/Oregon Live, 2 pp.

Zarkhin, F., 2014: 11-year-old Lake Oswego boy dies after tree falls on car during storm; mother expected to survive. The Oregonian/Oregon Live, December 13, 2014, 2 pp.

Last Modified: December 11, 2015
Page Created: October 14, 2015

| Back |