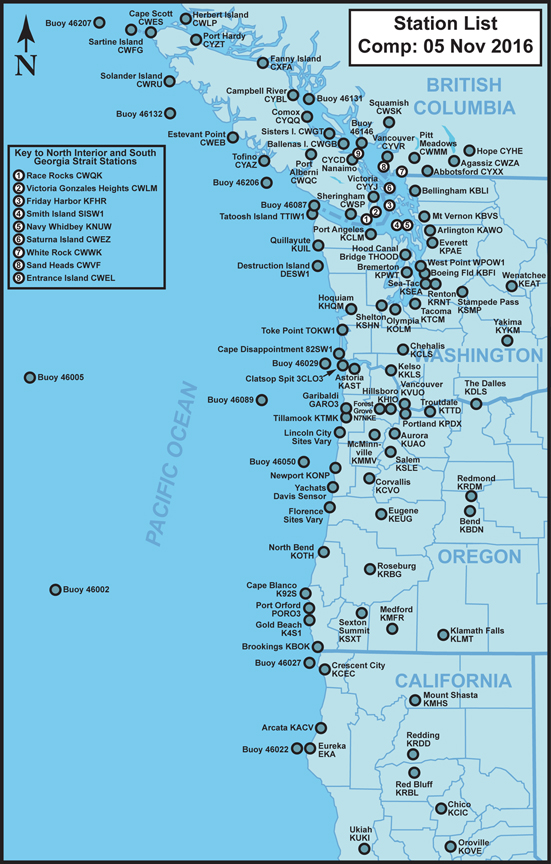
Figure 1.1 above Map of stations commonly used in the Storm King peak gust maps. These days (2016), there are so many stations available that large portions of this map would be literally covered in circles, names and identifiers, especially around major population centers. Generally speaking the further back in time, the fewer the stations. Click on the map to see a larger version. |
Peak gust maps are valuable to the understanding of windstorm outcomes. Effort is made to include one with every analyzed windstorm on The Storm King. The inspiration for these maps is Lynot and Cramer (1966), who, after their exhaustive analysis of the 1962 Columbus Day Storm, noted, "In view of the economic havoc of severe windstorms in Oregon and Washington, it is regrettable that previous storms have not been more thoroughly analyzed and documented... The publication of isotach patterns for specific storms would be useful in the same way that isohyetal patterns of total storm rainfall are useful." When peak gust isotach maps are created for several extratropical cyclones that follow a specific storm track type, patterns often become apparent in the distribution of wind speed across the landscape, providing insight that can help forecast destructive windstorms. The stations on the map were not selected at random, but are based on a number of factors. Since the purpose of this research to develop a windstorm climatology, stations with long histories are given the priority and especially those with records going back to the Columbus Day Storm. Airport stations are also given a higher priority because anemometers at these locations often have excellent exposure and are usually placed at a standard height of 32.8 feet (10 m), though this has varied over time. Lowland stations are preferred for a number of reasons: 1) most of the population lives in the lowlands; 2) lowland wind speeds are often the most conservative; and 3) there is a certain consistency in trying to keep the stations at roughly the same elevation, or at least in valleys. Point 3 above requires further consideration, mainly because highland wind speeds, especially those on mountain tops, seem to be getting ever more attention these days perhaps due to an ongoing proliferation of observation sites in remote areas. When reporting wind speeds across a large range of elevation, say 5,000 feet (~1,500 m) or more, the numbers would be more comparable if reduced to a sea level standard such as is done with barometric pressure. This is for a number of reasons, a key one being that the atmospheric density (often represented by "rho" the 17th letter of the Greek alphabet in meteorological equations) is lower. This is true even when accounting for the tendency for lower temperature at higher elevations. To generate an equivalent wind speed, say 75 mph (~120 km/h), the pressure gradient does not have to be as strong in the lower density atmosphere. Also, due to the lower density, a 75 mph wind does not hit as strongly as the same gust in a more dense atmosphere (i.e. at sea level). Finally, many high elevation stations are located on ridgetops where they are likely to be strongly influenced by the flow of the free atmosphere--in other words near-geostrophic winds that have not been slowed much by surface friction, unlike even the most exposed airport sites in the lowlands. Caveats such as this one included in a National Weather Service, Portland, public information statement about strong winds on March 10, 2016, are critical when reporting high-elevation wind speeds: "(BPA towers) are generally very exposed elevated sites that are not representative of nearby observations so use these observations with caution..." (all caps changed to mixed letters). Statements such as this should accompany all extreme wind reports from high elevation sites. Reducing gusts to a sea-level standard and accounting for things like ridgetop exposure is possible, but would also be quite involved. As an alternative, a statistical approach could be used where the gust speed percentile--the frequency that winds of the reported magnitude and above have occurred in the station history--would be reported alongside the actual speed. These numbers would be more directly comparable across stations of widely different elevations and exposures. This is another reason why sites with long histories are preferred for the peak gust maps: One can determine how unusual--infrequent--a reported gust speed is by reviewing the period of record for a station. When extreme wind speeds are reported, context is important. Favoring low-elevation or valley sites on the peak gust map is a basic attempt at leveling the playing field. With regard to data buoys (e.g. 46089) and well-exposed island sites (e.g. Saturna Island or CWEZ), it is good to keep in mind that surface friction over water is lower than over land. Relative to land, the reduced over-water turbulent drag tends to support faster near-surface wind speeds for a given barometric pressure gradient. These stations are favored for high readings, not to the extent of high elevation sites, but definitely more so than typical lowland stations. Speaking of buoys, a brief digression: It would be quite informative about Pacific Northwest windstorms, and also help with forecasting these events, to have more observation sites in the Northeast Pacific. My wish would be to have a network of data buoys placed on the corners of a grid no less than 1.0º by 1.0º from at least 135ºW eastward. Even better if some of these stations were equipped with rocketsondes. This wish, of course, is quite unlikely to happen. |

