|
The Great Coastal Gale of December 1 - 3, 2007 compiled by Wolf Read Many thanks to Cliff Mass, Steve Todd, Tyree Wilde and George Taylor for their input. |
|
|
|
A truly historic storm event, the Great Coastal Gale of December 1-3, 2007 will likely be remembered for many years. Over a period of three days, two separate storms lashed the coast with an incessant onslaught of hurricane-force gusts and heavy rain. The region between approximately Newport, OR, and Hoquiam, WA, received the strongest gale since the great Columbus Day Storm of 1962, with perhaps some areas of southwest Washington receiving even a stronger blow. Even though the October 1962 storm proves stronger in overall wind speed at many locations, the December 1-3, 2007 gale completely outclasses the Columbus Day Storm, and probably any other windstorm in the modern record, in terms of the duration of high winds. |
|
~ 94 mph ~ |
|
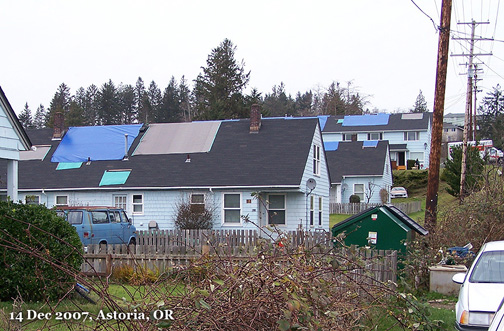
According to the December 2007 Local Climatological Data (LCD) publication from the National Climatic Data Center, the peak gust at Astoria, OR, on December 3, 2007 was 94 mph. The peak gust recorded during the Columbus Day Storm of 1962 was 96 mph. Assuming just a 1% error in measure at these unusually high speeds (the error is probably higher), these two peak gusts are comparable. Given the lengthy duration of the December 2007 event compared to the October 1962 event, the most recent windstorm appears to be the more powerful of the two. At least for Astoria. Some important considerations:
Before the December 2007 LCD publication, all available data pointed to a peak gust of 85 mph at the Astoria Regional Airport during the December 2007 windstorm. Apparently in these datasets, information from additional remarks, such as PK WND, were missing. In the dataset used by the NCDC, a PK WND report of 82 knots (out of 190 degrees) was probably present. Information from the dataset with missing PK WND reports appears in some graphs below: 85 mph will sometimes be the maximum value indicated. |
|
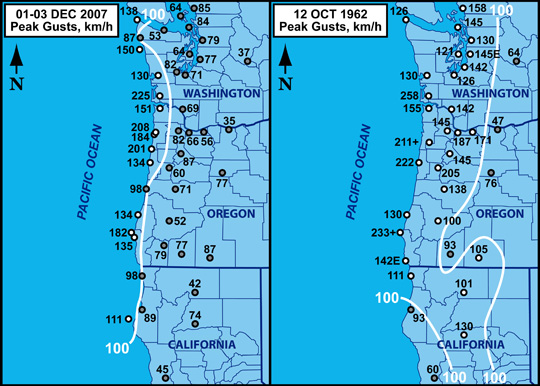
Figure 2, below, comparers the December 2007 Great Coastal Gale with the Columbus Day Storm of 1962. Note that peak gusts are in km/h (these graphics were made for an international meteorological conference). The Great Coastal Gale approached Columbus Day Storm intensity on the coast, but extreme winds did not occur among the interior sections during the 2007 event.
|
|
My Journal Notes |
|
Before The Storm: Nov 30 to Dec 01, 2007 November 30, 2007: Friday 13:01 PST: (Corvallis, OR) Aye, it's really looking like some major activity could begin tomorrow, with a possible snow event in the morning. I've participated in discussion with local weather-folk via e-mail, my usual wx-friends, and there's been discussion of all kinds of stuff lately. Steve Pierce sent on November 29, 2007, at 09:34:40 PM PST:
To which I replied on November 29, 2007, 10:09:19 PM PST:
This morning Steve Pierce sent out a copy of an Oregonian article about the possible upcoming storm, where Ira Kosovits of NWS, Portland, suggests the possibility of 90 to 100 mph sustained winds on the coast with that major low slated for Sunday/Monday. Such values would mark the new CDS—I just can't believe that winds would get this high from the situation I see in the models. Even Steve Pierce, who gets pretty excited when the forecasts start pointing to something interesting, thought the article sounded "overblown" in his words. George Taylor commented on this on November 30, 2007, 11:13:07 AM PST:
I commented on November 30, 2007, 12:00:11 PM PST:
These discussions about sum up the weather situation that seems to be unfolding, and point to a new level of wind warning that I hadn't heard of before: Hurricane Force Wind Warning. It would be interesting to see that level of warning used. I did some internet searching and see that it has been applied in southern Alaska, and on the British Columbia coast, even off of Vancouver Island, in recent years. The new level of wind warning became a forecast option in May of 2002, and might only get used once or twice a decade at the highest frequency. Such incredible wind speeds are, indeed, very rare for Oregon and Washington. 13:42 PST.
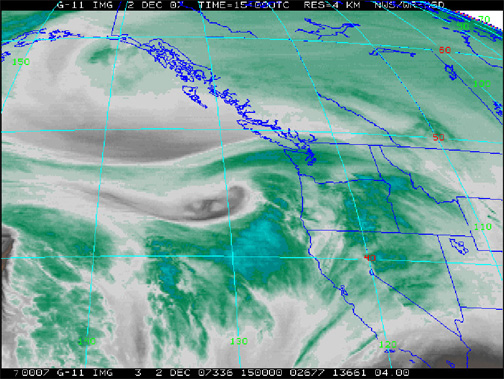
December 1, 2007: Saturday 18:49 PST: (Corvallis, OR) Periods of light to moderate snow struck around Tigard and Beaverton this morning, among many places in the Portland Metro area, but no accumulation occurred in the places that I traveled. The expected stationary low did develop off the coast of Vancouver Island, and was analyzed at 993 mb with the center just off the central coast of the island at 16:00. More persistent and heavier snow struck much of western Washington through the day, mostly between 09:00 and 13:00 or so. Hoquiam had light snow with the temperature around 36ºF and a dew point in the 30ºF to 32ºF range. Currently, the precipitation is light rain at HQM. Quillayute had snow, occasionally moderate to heavy, up until the 16:53 observation, with showers occurring as early as 02:53. The temperature hovered around 33ºF to 34ºF all day, with the dew point around 30ºF to 32ºF. Low pressure of 994.1 mb (29.35" alt) occurred around 16:53. Light E to SE winds were common during this interval of snow, with a recent shift to WSW 12 mph gusting 16 at 18:45, and a corresponding jump of temp and dew point to 37ºF and 34ºF respectively. The barometer was starting to rise at 994.4 mb (29.36" alt) by 18:53. So it looks like a weak frontal system has moved inland. Snow began in Bellingham around 02:53 with a NNE breeze of 10 mph and a temperature of 32ºF with a dew point of a dry 18ºF. By 11:01, the temp was 27ºF with a dew point of 21ºF, NNE winds had climbed to 20 mph gusting 26, and moderate snow was falling in freezing fog. These kinds of conditions have persisted through much of the day at BLI with the barometric pressure falling to 997.1 mb (29.41" alt) by 18:53, and light snow continuing. At Sea-Tac, two periods of snow occurred, the first between 05:53 and 07:13 then switching to rain despite a 32ºF temperature and 30ºF dew point. The second was of much longer duration, beginning at 12:53 with the temperature up to 37ºF but dew point down to 25ºF and SSE winds of 14 mph gusting 21 with the barometer at 1001.2 mb (29.54" alt) and falling. The southerly breeze of 12 to 15 mph with gusts up to 23 continued until 13:20, with snow intensifying to moderate. By 13:53 the temp had fallen to 33ºF and the dew point had climbed to 30ºF with SSE winds at 8 mph and the barometer at 1000.6 mb (29.52" alt) and falling. Then, a few minutes afterwards, by 14:00, winds shifted to ESE and this generally persisted until 15:53, with the snow reaching moderate and heavy intensity at times before 15:00. The temp matched the dew point of 30ºF by 15:16. Wind shifted to SE at 16:34, moving at 10 mph. Temp shot up to 34ºF. Snow changed to rain by 17:53, and by 18:53 the temperature had climbed to 35ºF with a dew point of 32ºF, and the barometer was down to 997.7 mb (29.44" alt). Snow at Olympia was more limited in duration, generally falling between 11:38 and 13:54, with S winds as high as 22 mph gusting 30 at 12:08. Yes, very breezy at Olympia, quite like the Willamette Valley right now. From 10:54 to the most recent observation at 19:07, winds have generally been 12 to 18 mph with gusts of 22 to 28 mph, occasionally higher. Temp during the snow was generally around 34ºF to 36ºF with the dew point around 28ºF to 30ºF. Currently, the precipitation at OLM is jumping between rain and snow, with the dew point hovering around 32ºF to 34ºF. There's even an unknown precipitation type being indicated at 19:07. I see from the NWS Seattle discussion that many places in Western Washington received 1" to 3" of snow accumulation, with some places, like the favored Kitsap Peninsula, even higher. Moderate rain, sometimes heavy, plagued me on my drive down I-5 to Corvallis this evening. A strong southerly wind buffeted the car, especially as I drove westward down Highway 34. The gusts quickly blasted spray from eastbound trucks into my lane. With the sun down below the horizon, standing water on the roadway, and the misty, socked-in atmosphere surrounding me, the drive was a bit nerve-wracking. People were stranded in places, probably engine breakdown, and I felt sorry for them working on their cars out in the cold, wind-blasted landscape. At 18:54, the barometer at Eugene read 1006.2 mb (29.71" alt) after a low of 1005.3 mb (29.68" alt) at 16:54. At 18:53, the barometer at Portland read 1002.5 mb (29.60" alt) after a low of 1002.2 mb (29.60" alt) at 17:53, and a reading of 1002.5 mb (29.60" alt) at 16:53. Thus, at 16:53 the EUG-PDX gradient was +2.8 mb and at 18:53 it was +3.7 mb. Not super-steep, but enough for a decent strong breeze through the Valley. At PDX, winds reached S 23 mph gusting 28 at 16:53, with a peak wind of S 30 mph at 18:21. At Salem, S winds reached 25 mph gusting 31 at 16:56 with a peak wind of 37 mph at 16:42. At Eugene, S winds reached 20 mph gusting 29 at 13:54 and 21 mph gusting 28 at 14:54. Other winds include S 23 mph gusting 29 at 14:35 in Corvallis, and peak gusts of S 30 mph at McMinnville at 17:10, S 31 mph at Aurora at 18:04, S 23 mph at Hillsboro at 16:53 and S 21 mph at Troutdale at 18:53. Southwest winds poured into Astoria around 17:22, climbing to 22 mph gusting 35 at 17:55 with a peak gust of SW 37 mph at 17:00. This after a period of modest southerlies. A little bit of snow fell there at 08:10. Since then, it's been rain, heavy at times, reaching rates of 0.12" in the hour ending 12:55. The semi-stationary low off of Vancouver Island is expected to lift northward as a developing cyclone, currently near 40ºN and 139ºW heads in our direction. The latest MM5 runs, both the GFS and NAM, show this cyclone tracking northeast and landing in the vicinity of Hoquiam between 13:00 and 16:00 with a 990 mb central pressure. It's possible that this storm may bring gusts of 40 to 50 mph in the Willamette Valley, and gusts upwards of 75 mph on the Oregon coast. And afterward, a much bigger, and deeper low heads toward Vancouver Island for a protracted rain and wind event beginning late Sunday. I'm going to be very busy typing. 20:01 PST.Two Storms Strike: Dec 02 to Dec 03, 2007 December 2, 2007: Sunday 07:38 PST: (Corvallis, OR) Based on the 15:00 UTC (07:00 PST) water-vapor satellite image, the low center is now at 44.5ºN and 130ºW and moving ENE. Here's the 15Z image:
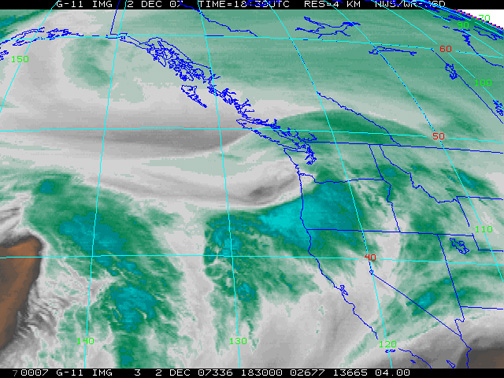
Buoy 46002 at 42.57ºN and 130.46ºW showed a low pressure of 991.8 mb (29.29") with SSW winds at 31 mph gusting 40 at 05:50. As of the most recent observation at 06:50, the barometer had elevated to 29.31" and the winds were 29 mph gusting 36. Temperature was a toasty 57.2ºF. Highest winds were S 38 mph gusting 47 at 03:50 as the low center closed on the vicinity. Max hourly pressure falls were from 29.53" at 00:50 to 29.46" at 01:50 and 29.39" at 02:50. Though the low is pssing a couple degrees north of this station, these conditions don't reflect a super-intense storm. But certainly forceful. Doing a search for other observations within 250 nautical miles of this data buoy, a ship report from 06:00, located at 42.60ºN and 125.30ºW, showed average winds of 59 mph and 18 foot waves in the vicinity. Buoy 46005, located 46.05ºN and 131.02ºW, some 210 nautical miles to the north (354º) of Buoy 46002, still shows a fast-falling barometer at 06:50 with a reading of 29.21". The pressure fell 0.05" in the last hour and 0.15" in the last three. That's a low pressure of 989.2 mb so far, and with E winds of 16 mph gusting 21, the low hasn't passed to the north or east of this station yet. A chilly air temperature of 42.8ºF contrasts sharply against the warmth at Buoy 46005. A ship at 50.00ºN and 131.10ºW reports a pressure of 29.38" with northerly winds at 15 knots. Locally, Corvallis at 07:55 showed an altimeter of 29.65" and falling rapidly (0.05" in the last hour) with winds S 8 mph and light rain, 0.04" added in the past hour. Temp 43ºF with a dew point of 37ºF: December standard. Eugene at 07:54 had a pressure of 1004.1 mb (29.65" alt), S winds at 15 mph, 0.01" of rain in the last hour and 45ºF with a 37ºF dew point. Salem at 07:56 had a barometer at 1003.0 mb (29.62" alt), down 1.5 mb in the last hour, S winds at a forceful 20 mph gusting 30, 0.03" rain in the past hour, and 44ºF with a 39ºF dew point. Since 03:56, winds at Salem have been 20 to 22 mph with gusts of 25 to 39. Peak wind 39 mph at 03:48--most likely related to the Vancouver Island low shifting northward. Portland at 07:53 had a barometer at 1004.1 mb (29.65" alt) with SSE winds at 9 mph, 0.03" rain in the last hour, and 44ºF with a dew point of 41ºF. At 01:53 winds were 22 mph gusting 32, with a peak gust of 33 mph at 01:41. Peak gust at Aurora was S 38 mph at 00:13. And, wow, currently at McMinnville, 07:53, winds are S 23 mph gusting 37 with that peak at 07:48. So, still windy in parts of the Valley even as the next low approaches from the west-southwest. Here at Corvallis, winds peaked at S 25 mph gusting 31 at 23:55 and 0.80" of rain had fallen in the 24-hours ending 03:55. Finley had 0.81" in the same 24-hour period. 08:20 PST. 08:40 PST: With today's and tomorrow's storms, the winds at 850 mb height will reach 75 to 100 knots. Lots of 80 to 90 knot barbs all over the western half of the state. NWS Portland (Tolleson), during the 03:23 discussion, mentions that 100 knots is five standard deviations outside of normal. So, for the incoming storms, wind velocities at the surface could very well be outside of normal. This is an interesting detail that could make for some very lively weather. 08:46 PST. 10:30 PST: Wow: Eugene, 09:54 observation, S 29 mph gusting 41, with a peak gust of 44 mph at 09:25. Strong winds have arrived! Temp is 45ºF with a dew point of 38ºF, and the barometer is 1005.0 mb (29.67" alt) and rising 1.0 mb in the past hour (low pressure 1004.0 mb at 08:54). Here at CVO, S winds have reached 23 mph gusting 29 at 09:35 and 10:15, with moderate rain with 0.12" accumulating in the hour ending 09:55 and 0.09" accumulating in the 20 minutes ending 10:15. Pressure 29.63" (alt) and steadyish, though rising from a low of 29.60" (alt) at 08:35. Gale force gusts in Salem, too: S 28 mph gusting 40 at 09:56, with the peak of 40 at 09:48. Pressure 1002.3 mb (29.60" alt), up slightly from 1002.1 mb (29.50" alt) at 08:56. At Portland, the winds were still quite light: SSE 8 mph at 09:53, with the barometer at 1003.0 mb (29.62" alt). Moderate rain with 44ºF and a 41ºF DP. On the most recent satellite photos, 18:30 UTC [shown below], the center of the low appears to be at 46ºN and 128ºW and moving ENE toward Hoquiam. The HPC analyzed the low at 988 mb for the 07:00 timeframe. With the barometers rising in the Valley, it looks like the low will go north of here, but I wonder how much of the barometric response may be due to a leading warm front moving through the area. We'll see how the temperatures respond in the next few hours.
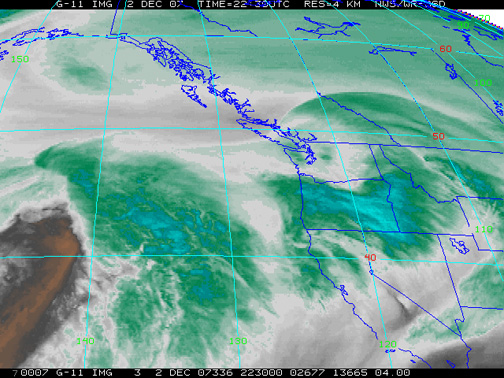
Looking at the Oregon Coast, North Bend had maximum winds so far of S 28 mph gusting 49 at 09:15, and a low pressure of 1003.1 mb (29.62" alt) at 07:55. Altimeter at 29.70" at 10:35, with winds of S 22 mph gusting 37. Temperature 48ºF with a dew point of 39ºF. At Newport, the most recent wind observation at 10:31 shows SSW 38 mph gusting to 62. That's high-wind criteria! At the same time, the barometer was at 29.53" (alt) and at its lowest point (so far). Winds were S 39 mph gusting 55 at 10:11. At 09:55, Astoria had a pressure of 997.8 mb (29.47" alt) with winds at S 20 mph gusting 41. At 08:55, the winds were S 20 mph gusting 47. Lots of special observations after 09:55. At 10:44, the altimeter had fallen to 29.43" (!) and winds were blowing at S 26 mph gusting 45, with a peak wind of 46 mph at 10:33. Now a new observation has come in: S 31 mph gusting 54, with the peak gust at 10:55, and altimeter at 996.3 mb (29.42" alt). Wow. This looks to be a potentially significant, but narrowly-focused windstorm in progress. All right, the 11:00 AM observations are now up for the Valley. Eugene, 10:54, S 23 mph gusting 32 with a peak of 38 mph at 09:56. The barometer is falling again at 1004.7 mb (29.67" alt). Corvallis, 10:55, S 23 mph gusting 32, with a peak wind of S 23 mph gusting 35 at 10:35. Salem, 10:56, S 28 mph gusting 44, peak gust 45 mph at 10:39, with the barometer at 1002.1 mb (29.59" alt) and showing a downward tendency. McMinnville, 10:53, S 28 mph gusting 40. Portland, 10:53, S 15 mph gusting 24, with a pressure of 1002.7 mb (29.61" alt) with a downward trend. Aurora and Hillsboro both have gusts in the 20 to 30 mph range. The 10:52 report from Newport showed winds at S 47 mph gusting 62, with the temperature up to 52ºF from 48ºF in the previous report. The pressure is 29.53" (alt) and steady-ish. North Bend at 10:55, S 25 mph gusting 41, with the barometer at 1005.8 mb (29.70" alt) and steady. That's a +9.5 mb gradient between OTH and AST. 11:12 PST. 11:24 PST: Wind gusts through the trees are getting quite loud now. The rushing sounds like a busy superhighway at times. Rain continues to fall. The 11:15 observation at CVO had winds at S 30 mph gusting 35. That's one of the highest 2-minute winds I've seen there. Altimeter down to 29.62". Rainfall 0.20" in the hour ending 09:55. Heavy. Oh, WOW! Newport S 46 mph gusting 78 at 11:11 with altimeter down to 29.52". Seventy-eight!!! This is serious. 11:29 PST. 12:18 PST: Looks like the low is moving into Southwest Washington right now. Newport was shredded: At 11:34, the observation showed winds at SSW 55 mph gusting 82. Gusts over 80! Rare, indeed, for the airport station. The 11:51 and 12:13 observations showed SSW 45 mph gusting 68 and SSW 49 gusting 68. This is simply a major windstorm for the Newport area. Astoria at 11:55, S 33 mph gusting 69! Peak gust at 11:53. Pressure is 996.0 mb (29.41" alt), and the temperature is now up to 50ºF from 48ºF an hour ago. Comparatively, Portland's readings are amazing. At 11:53, the winds were S 8 mph, with the barometer at 1003.4 mb (29.63" alt) and rising. Temp at 44ºF with a dew point of 42ºF. Winds at Aurora are SW 5 mph (11:53) with the barometer at 1003.0 mb (29.62" alt), after being SSW 15 mph gusting 26 at 10:53. But McMinnville had S 28 mph gusting 36 at 11:53, with a peak of 40 mph at 11:36. Strong winds just to the south of the Metro Area! Salem, at 11:56, had S 24 mph gusting 35, with a peak of 43 mph at 11:40. SLP 1002.1 mb (29.59" alt). Notice the negative gradient from SLE to PDX. Kind of weird, but helps explain the low winds up north. Eugene, at 11:54, had S 23 mph gusting 37, with the peak of 37 at 11:50. Pressure 1004.4 mb (29.66" alt) and roughly hanging steady. At 11:53, the pressure at Hoquiam was 995.7 mb (29.39" alt) and still falling, with an altimeter of 29.37" at 12:25. Winds had jumped from E 15 mph during the former observation to SE 36 mph gusting 44 by the latter observation, with a temperature jump from 42ºF to 52ºF (!) in that half-hour. Looks like low center is very near Hoquiam now. Doppler shows heaviest rain up north, over NW Oregon and SW Washington, including the northern Valley. Seems like that's were the leading frontal boundary is, and this may also help explain the lighter winds in the North Valley. 12:36 PST. 12:40 PST: Just looked out the window. A cascade of rain thunders outside. So, that area of high precipitation seems to be all over the Valley. [At far distances from the Doppler station--such as over the southern Willamette Valley--the 10 cm signal likely overshot much of the cloud cover, and precipitation.] 12:41 PST. 12:51 PST: Our lights have been flickering a bit in the last 30 minutes. Wind gusts still occasionally tare through the trees around the house. CVO observation at 12:35 showed S 25 mph gusting 35. 12:51 PST. 13:35 PST: Newport, ONP, at 12:32, had winds going at an incredible SSW 58 mph gusting 83, with the temperature up to 54ºF, and the altimeter down to 29.52". Since then, the wind reports have gone: SSW 52 mph gusting 72 at 12:51, SSW 52 mph gusting 72 at 13:12 and 54 mph gusting 69 at 13:31 PST. At Astoria, a report at 12:20 showed S 31 mph gusting 61, and after that, at 12:55, wind reports have ceased, though we get a barometric pressure of 996.7 mb (29.43" alt) and rising. Hoquiam at 12:53 shows S 40 mph gusting 51 with a peak gust of 52 mph at 12:38. The barometer was down to 995.1 mb (29.38" alt). Going north to Quillayute, at 12:53 the barometer read a low 988.7 mb (29.20") with SSE winds of 13 mph gusting 25, which escalated to SSE 22 mph gusting 35 at 12:08. Note the gradient between Hoquiam and Quillayute for the 12:53 observation period: +6.4 mb. UIL had 0.37" of rain in the hour ending 12:53. Looks like the low in going in a bit further north, like into the tip of the Olympic Peninsula. Winds seem to have reduced a bit down here: S 24 mph gusting 31 at 13:15, with the altimeter showing a rising trend at 29.66", and S 23 mph gusting 29 at 13:35 with altimeter unchanged. 13:44 PST. 15:11 PST: Looks like the wind is picking back up at Eugene. At 13:54, S winds were 25 mph gusting 38, with a peak of 41 mph at 13:43, and at 14:54, S winds were 28 mph gusting 38, with a peak gust of 40 mph at 14:28. The barometer was falling at 1005.1 mb (29.68" alt) at 14:54, down from 1005.6 mb (29.69" alt) at 13:54. Temp and DP 46ºF and 42ºF during most recent obs. Here, at 14:55, the CVO winds were S 24 mph gusting 31, showing a downward trend, with the altimeter at 29.65" also trending downward. Newport is also showing a downward trend, with SSW 47 mph gusting 61 at 13:52. Altimeter 29.54" and going down from 29.56" at 13:12. Wind reports resumed at Astoria at 14:14, with SSW 29 mph gusting 59 noted at that time. The 14:55 regular report showed SSW 33 mph gusting 56, with a peak gust of 59 at 14:08. The pressure read 997.6 mb (29.46" alt) and rising slowly. The lights just dimmed twice in the past half-minute. Kind of worries me: Without power, I lose the internet, and my connection to all this great data. Hopefully the electrons will keep flowing! Hoquiam at 14:53 had S winds at 38 mph gusting 46, with a peak gust of 54 mph at 14:10. The barometer read 996.3 mb (29.41" alt) and rising from the low of 995.1 mb (29.38" alt) at 12:53. At Quillayute's 14:53 observation, the wind blew gently at SSW 8 mph and the barometric pressure had elevated to 991.7 mb (29.28"). Lowpres, like at Hoquiam, was at 12:53 and has already been noted at 988.7 mb. Looks like the low landed around 13:00, and is now well inland. Pressure rises are being arrested by the approach of the much bigger low that still is outside of 140ºW and is in the vicinity of 40ºN. A huge moisture plume is already reaching into Oregon and stretches all the way to Hawaii. Looks like the next low is actually at 44ºN and 142ºW, a developing wave on the second storm's massive front [22:30 Z (14:30 PST) water-vapor satellite photo shown below].
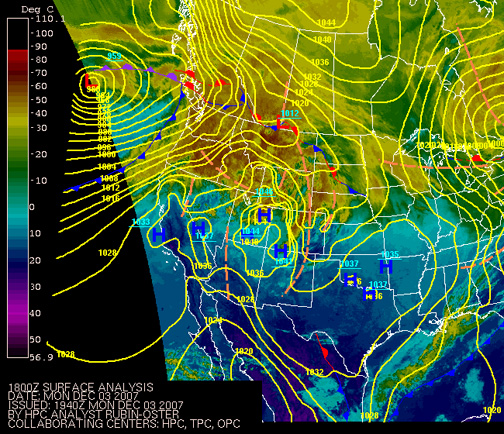
The current low center went north of Puget Sound Country. This is evidenced by: South gusts to 40 mph at Olympia at 14:54 with a rising temperature at 44ºF, and S gusts to 46 mph at Sea-Tac at 14:31 with the temp up to 46ºF at 14:53 and changing to rain the morning snow that occurred between 06:53 and 07:53. Low pressure at SEA so far was 996.6 mb (29.41" alt) at 14:53. Hmmm… Gusts to 35 mph at Chehalis and 43 mph at Kelso early this afternoon make the much lighter winds in Portland Metro quite interesting. The Gorge Effect may have been the primary cause of the lower gusts. Well, they've picked up now: S 25 mph gusting 33 at PDX at 14:53. Southerlies elevated after a period of calm at 12:53. Aurora had a S gust to 44 mph at 14:02. So the North Valley is now on par with the rest of the Willamette Basin. 15:38 PST. 20:12 PST: Now, the situation gets weird, as today's surface low fades away, and the big "monster" storm moves into the offshore waters. The situation is, perhaps, a bit out of my experience due to those very fast 850 mb winds. The huge cloud shield that marks the leading warm front covers a huge swath of the Northeast Pacific. It would easily cover all of WA, OR, CA, ID and NV. The significant wave ahead of the primary low is now centered around 46ºN and 136ºW. Buoy 46005, at 18:50, had a barometric pressure of 29.10" and falling 0.04" in the past hour. SSE winds are 14 mph gusting 18. Buoy 46006, out at 40.89ºN and 137.45ºW, had a barometric pressure of 28.80" and rising slowly at 18:50, with a lowpres of 28.72" at 16:50. The center of the primary low is still to the west of this station. Substantial wind drama from today's storm continued at some stations. Astoria has had some amazing wind readings: At 17:55, S 28 mph gusting 74 (peak at 17:51). At 18:12, SSW 33 mph gusting 67 (peak at 17:58). And, after a period of somewhat lower winds, at 19:55 SSW 33 mph gusting 61 (peak 19:54). Hoquiam had peak winds of S 36 mph gusting 61 at 16:53, with the peak at 16:44. The last report out of Newport was SSW 47 mph gusting 61 at 13:52. Another surge of winds brought velocities up to SSE 28 mph gusting 47 at North Bend around 19:35. Crescent City hit SSE 36 mph gusting 52 at 16:56. Winds have calmed down considerably in many parts of the interior of western Washington and Oregon. Salem still shows brisk winds, with S 21 mph gusting 32 at 07:56, with a temperature of 49ºF, dew point 45ºF and the barometer at 1002.4 mb (29.60" alt) and on a slow downward trend it would seem. Peak winds hit at 13:56 with S 28 mph gusting 43 with a peak gust of 54 mph at 14:43, likely the highest in the Valley. SLE also had gusts of 48 mph at 13:26 and 15:15, so a pretty decent gale persisted there for a couple of hours. Winds are still howling at McMinnville, with S 33 mph gusting 41 during the current 19:53 observation, peak at 19:52. These are the highest winds of the day for MMV. Even the entrenched cold air at Bellingham couldn't endure the onslaught of the incoming low. NNE winds of 9 mph at 12:53 with a 32ºF temp and 30ºF dew point, were accompanied by light freezing rain. At 13:42, the wind shifted to NNW 3 mph, and the temperature climbed a bit to 34ºF with the dew point staying the same. No precipitation. At 13:53, winds were calm, and the pressure neared its low at 996.4 mb (29.35" alt). At 14:14, winds had shifted to ESE at 10 mph gusting 20 and the temperature leaped to 41ºF with a dew point of 34ºF, and light rain was carried on the breeze. By 14:53 winds had shifted to SSE at 17 mph gusting 39, the temperature rose to 42ºF with a 35º dew point, and the low pressure of 994.2 mb (29.33" alt) had been reached. Quite the change of conditions in a short period. 21:08 PST. December 3, 2007: Monday 00:12 PST: (Corvallis, OR) Wind is picking up on the coast again, even as it continues to relax in the Valley. At 22:11, Astoria had a peak gust of S 77 mph, perhaps the highest wind gust at this location since the Columbus Day Storm. Average winds have been as much at SSW 44 mph at 22:44. At 23:39, Hoquiam had a gust of SSE 67 mph. Average winds reached S 45 mph at 23:44. Newport (ONP) is still offline, but NWPO3 is still reporting, part of the NDBC suite of stations. At 00:00, S winds had climbed back up to 49 mph gusting 59 from S 39 mph gusting 48 the hour before. The peak gust at this station was 36.6 m/s, or 81 mph at 14:07, a close match to the peak of 83 mph at ONP. Continuing the look outside of primary stations, some spectacular readings can be found: At 23:22, the winds at Cape Blanco were 94 mph gusting 113. Thanks to Steve Pierce for e-mailing that to me. At the Yaquina Bay Bridge, SW winds reached 62 mph gusting 85 at 11:49, and a peak gust of 88 occurred at 12:49. Lincoln City had a S gust to 91 mph around 15:19. The Tillamook Airport had a S gust to 66 mph at 19:30. Mt. Hebo had a gust to 83 mph around 16:04. The Cape Meares anemometer is now toast, after going through a major beating. At 19:47, the system read SW 69 mph gusting 114, and at 20:02 the anemometer read WSW 70 mph gusting 111. After that, a caution flag is placed on data with rapidly diminishing average wind speeds, despite high gusts (N 19 mph gusting 92 at 20:31!) and by 21:01, the anemometer reads "CALM" despite high winds continuing at other stations. More inland, in the Coast Range, the maximum gust at Rockhouse1 RAWS has been 51 mph on several occasions, the most recent at 23:12 and out of the SW. The wind is still tearing at McMinnville, with S 30 mph gusting 43 at 23:53, and a peak gust to 48 mph at 23:31. Salem was down to S 21 mph gusting 28 at 23:56. Wow, wind is beginning to really blow at Hillsboro now. S 26 mph gusting 43 at 22:53, and S 30 mph gusting 40 at 23:53. Peak gust S 40 mph at 21:40, a whopping 51 mph at 22:33 and 47 mph at 23:36, all out of the S. This is amazing: HIO isn't usually one to lead the pack. And this while PDX is mired in ESE winds of 16 mph gusting 22! Temp at PDX 44ºF with 44ºF dew point, and at HIO 51ºF/49ºF. 00:50 PST. 00:52 PST: This wind event could overwhelm me! Astoria at 00:28 had S winds of 48 mph gusting 64 mph with a peak gust of 69 mph at 23:57. And at 00:37, Astoria reported S 43 mph gusting 74, with that slamming gust at 00:31. Well, I think I should try to get some sleep. 00:59 PST. 14:29 PST: Yep, it happened. I've been overwhelmed. With the current series of storms, history is definitely being made. Incredible amounts of rain have fallen and continue to stream from the low, gray and misty sky. This is especially true in the Oregon Coast Range north of a Newport to Salem line. Mudslides have occurred, rivers are rising to flood-stage very rapidly, and many roads are closed. Some of the closures are due, of course, to a heavy loss of trees during an overnight gale on the coast that, to use a pun, took my breath away. Getting back to the deluge, all of western Washington and northwest Oregon north of Cottage Grove is under flood warning. For the 24-hours ending at 06:00, Mt. Hebo had 8.55" of rain, South Fork Raws 8.79", Cedar Mtn Raws 7.92", and Lees Camp 9.90". Less Camp had 11.70" in the 48-hours ending 06:00. In the Valley, some 24-hour totals include Hillsboro with 2.98", Scappoose 3.66", Portland Airport 1.75", Forest Grove 3.70", Corvallis 1.47" and Eugene 1.35". Here in Corvallis, we've added nearly an inch since about 06:00. I just looked out the window. The landscape is awash in rain and mist. A gray, dripping world where visibility is definitely below a mile. A saturating moderate fall of liquid drops seems to just bleed from the atmosphere. Blustery winds shimmy the trees. And it's warm out there. Comparatively. A muggy, humid 55ºF now. Up to 57ºF at times. The last report from Astoria was at 04:03, with winds at SSW 32 mph gusting 64. At 03:55, winds at AST were SSW 36 mph gusting 68 with a peak gust of 76 mph at 03:00. Pressure was 998.2 mb (29.48"). At 02:55, Astoria reported its maximum gust at SSW 44 mph gusting 85, peak at 02:47. That's simply incredible. For the central and north Oregon coast, this is the strongest windstorm since Columbus Day 1962. And the current event has lasted much, much longer. Evidence from still-working anemometers seems to suggest at least a 24-hour-long duration for 60 mph and higher gusts, even for Astoria. This beats most, if not all, storms. Most windstorms occur within a 2 to 6 hour window, with "long" ones being in the 8 to 12 hour range. The current storm is off the charts. Hoquiam's last report was at 00:53, with S 49 mph gusting 81, peak at 00:47. Pressure was 995.4 mb (29.39" alt) at this time. This compares to 995.9 mb (29.41" alt) at the same time in Astoria. The 81 mph gust ties the HQM peak for the Columbus Day Storm, the peak for the November 3, 1958 storm and the peak for the Thanksgiving Day storm of 1983. Given that high winds likely continued at HQM for some time after the last observation, a new high-gust record may have been set by this new storm. The HPC 18:00 UTC [10:00 PST] surface analysis puts a deep 959 mb low at about 46ºN and 135ºW [shown below], with a triple point over north Vancouver Island and a long cold front trailing from that southward along 126º to 127º W. At 21:00 UTC, the surface analysis shows the cold front moving through the Willamette Valley, with the big surface low, now 966 mb, at about 47ºN and 131ºW. There could be another round of strong winds in the Valley as this major low moves inland over British Columbia.
Around noon I was interviewed by Stuart Tomlinson of the Oregonian about the big windstorm. Told him my thoughts about this being the strongest event since the Columbus Day Storm for the coast, and how I was impressed with the level of forecasting that went into this system. The NWS, Portland, got the wind effects essentially spot-on, and this two to three days before the big gale. I think George Taylor sent Tomlinson my way, probably because of an e-mail I wrote this morning and sent to my weather buddies at 11:16 PST:
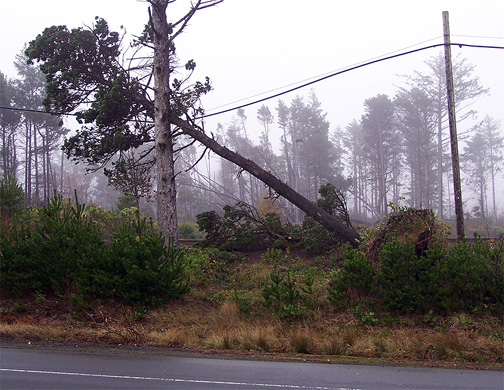
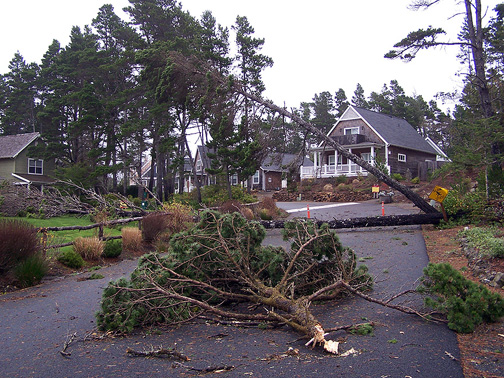
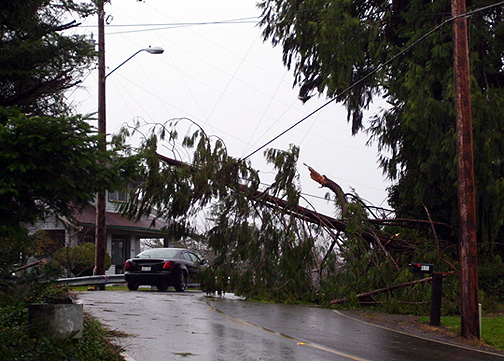
That 86 mph for AST should be 94, but the gist of the message is right. 15:20 PST. The Aftermath: Dec 04, 2007 and Beyond December 4, 2007: Tuesday 08:14 PST: (Corvallis, OR) The rain broke into showers during the evening, and southerly winds picked up to 20 to 26 mph with gusts of 24 to 32 at CVO. The altimeter showed a steadily rising trend from a brief downturn to 29.78" at 13:35 to 29.91" at 18:55 and 29.99" at 21:55. Winds slowly diminished after the latter observation and shifted to the SSE, with the temperature hovering around 55ºF to 57ºF, occasionally up to 59ºF. The major surface low weakened during the whole period, and at 07:00 was landing on the British Columbia coastline just to the north of Vancouver Island as a 990 mb system. Corvallis had 1.55" of rain in the 24-hours ending 03:55. For the same time period, rainfall totals include: 2.18" at Finley (max 24-hour 3.01" at 16:45, and max hourly 0.21" at 15:45), 1.28" at Salem (max 1-hr 0.28" at 21:56), 1.33" at Portland (gusts to 41 mph in the last wind episode in the afternoon), and 1.51" at Hillsboro. As I drove my daughter back to Tigard, I heard on the radio that I-5 between Portland and Seattle was completely closed. Said the road could be shut down for 38 hours. Recommended flying if a trip to Seattle was needed. Highway 6 also shut down. And Highway 101 between Tillamook and Astoria was blocked in many places by slides and fallen trees. This is just a small sampling of a big road closure list. Despite the challenge of blocked roads, I'm going to try to get to the coast today and see if I can get some photos of the damage. Heading to Newport, and will see how far I can get on 101. Looks like Hwy 20 and 34 are open. I better gear up and head out the door. Daylight doesn't last long in December. 08:33 PST. 21:32 PST: I left for the coast around 09:30, and returned at 20:30. I took Highway 20 out to Newport, then headed north on Hwy 101 through Depoe Bay, Lincoln City, Tillamook, Bay City, Garibaldi, Rockaway, and out to Manhattan Beach State Park. Eleven hours of travel through a region that suffered some incredible damage from wind and flood. Very low stratus, some rain-bearing, hung over much of the coast, and, at times reached the surface to make a dense fog. These clouds shrouded much of the distant landscape, and at times even the forests alongside the road were lost in the gray mist. The fog seemed to reflect upon coastal communities that had been seriously pummeled and hadn't fully regained full consciousness from a knockout blow. A persistent grogginess that prevented one from grasping the full extent of injury to the landscape. But, I saw enough. And fog didn't hide the ruin in the northern stretch of coast with its soothing out-of-sight-out-of-mind embrace. The damage exceeded anything I've seen from a significant windstorm, especially among the northern communities. But even in the southern part of my tour, the damage stood out: At least 48 trees fell across Hwy 20, most of those in the last 15 miles. That started things off. Once at Newport toppled trees became a common sight, and the further north I traveled, the worse the destruction became. Just when I thought things couldn't get any worse, I'd roll into a region with even heavier damage. After many miles, I ceased to be surprised. Damaged structures, not just toppled trees, eventually became commonplace. Based on what I could glean during my travels through fog and periodic rain showers, the storm's impact breaks into four fuzzy sections:
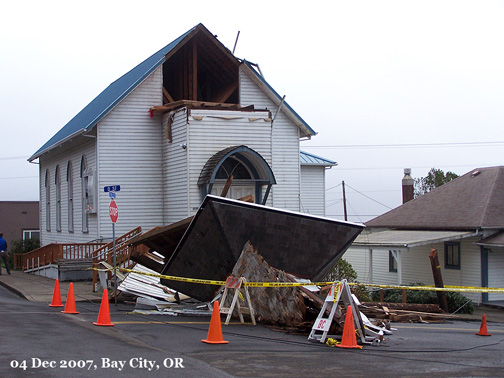
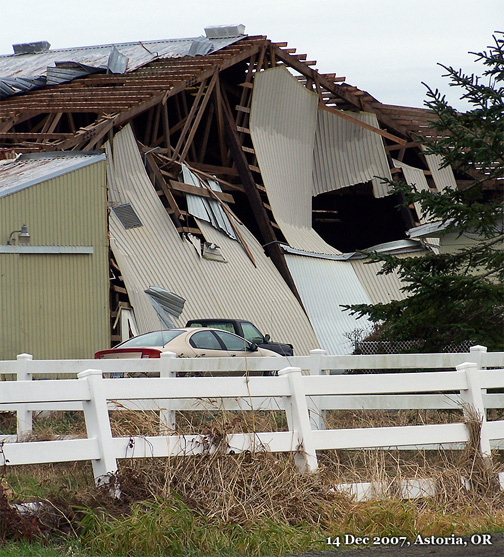
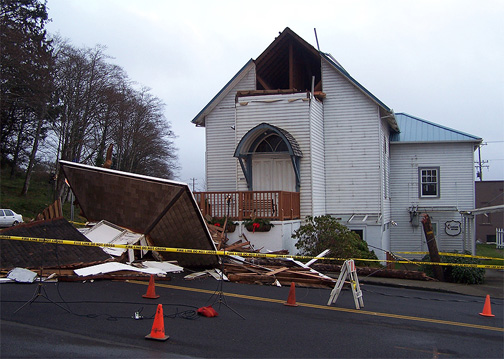
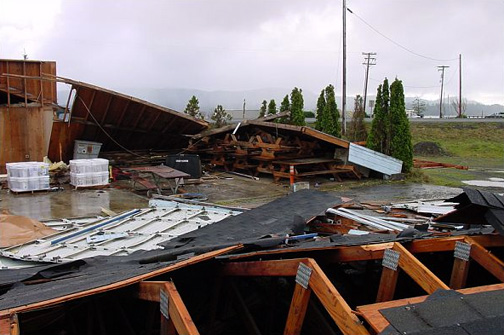
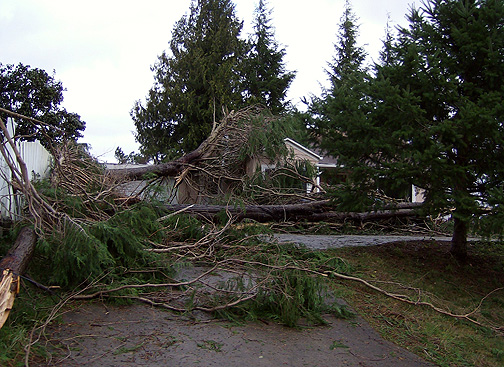
Flooding contributed to the sense of disruption around Tillamook. Much of the section north of downtown had been inundated. By the time I got there, the water had receded, and I could continue northward on a highway covered in slick, brown silt. People worked hard to scrape the mud from the parking lots of stores and restaurants along Hwy 101. Some stores had opened, including a McDonald's that had suffered some roof damage, downed trees and a coat of mud in the parking lot, and had "Cash Only" notes posted all over the grounds. Even among the widespread damage so clearly evident along the entire stretch of 101 that I drove, the destruction around Garibaldi and Bay City stood out in high relief. A church steeple, torn off in the gale and dashed to pieces in the street in Bay City, reminded me of photos of broken building spires from the Columbus Day Storm [more images appear in a storm photos section below]:
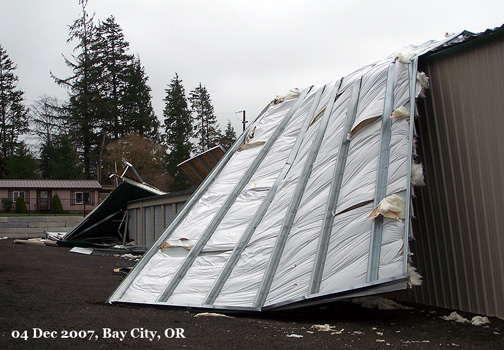
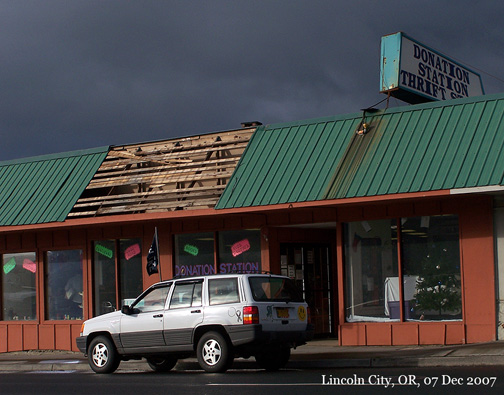
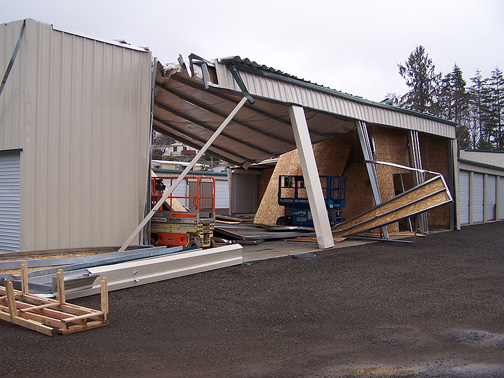
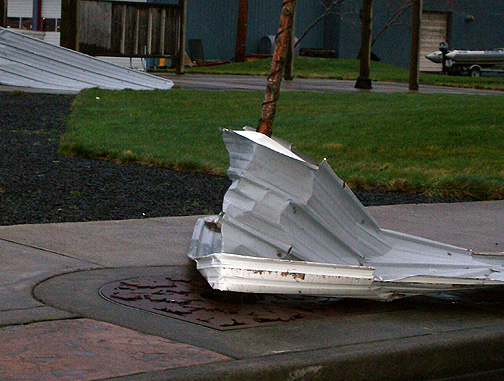
This public storage building had its roof torn off and walls disrupted as if it were made of paper:
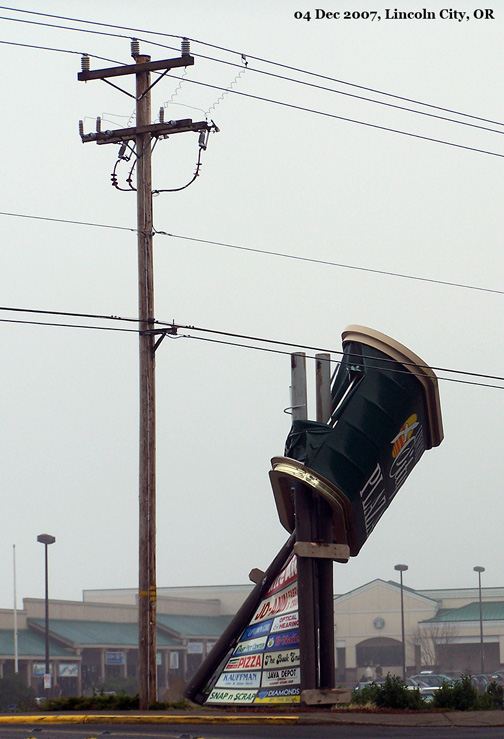
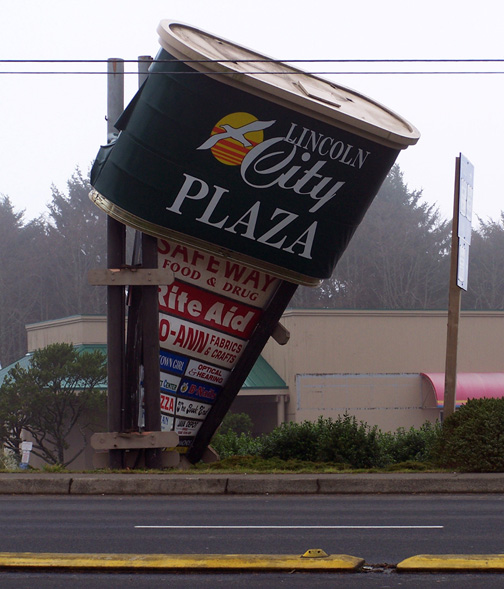
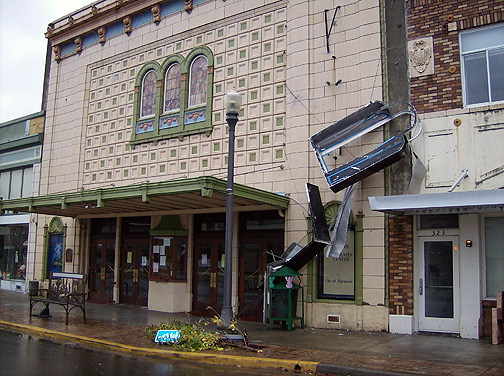
At the above facility, a man unloading equipment from his van and into a garage-style storage room in a neighboring building told me that he had considered renting the smashed room just the day before. Fortunately the room that he finally chose ended up in a building that weathered the storm just fine. In Lincoln City, the large sign below broke under the strain of hurricane-force gusts. A local anemometer, one ideally favored on a bluff over the ocean, registered a gust of 125 mph.
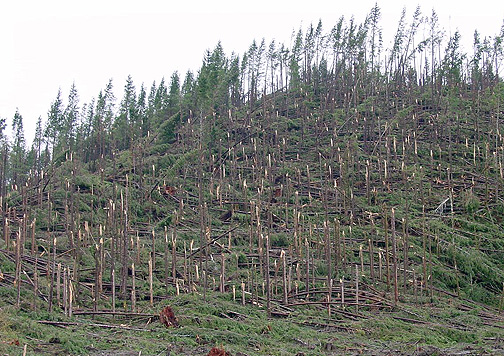
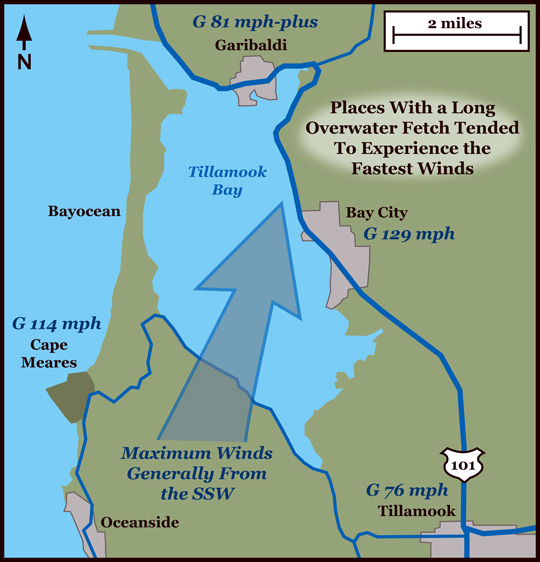
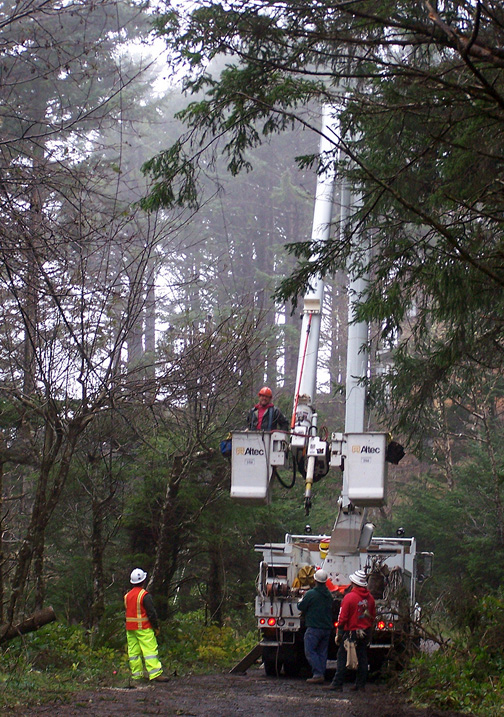
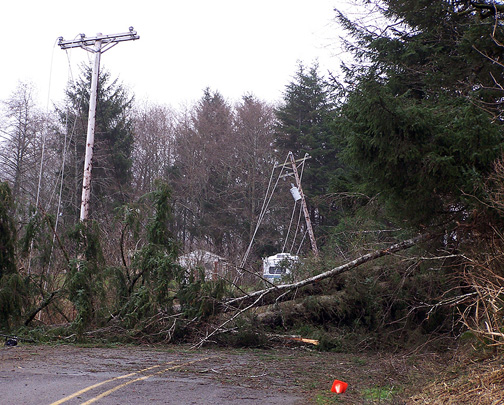
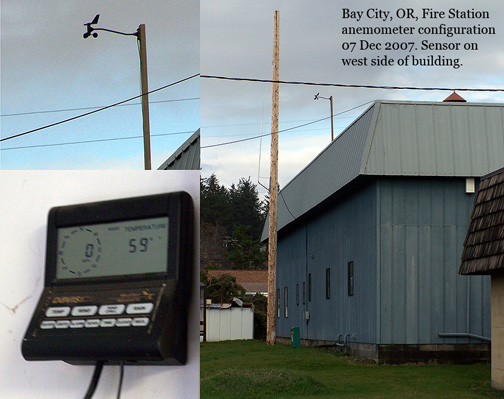
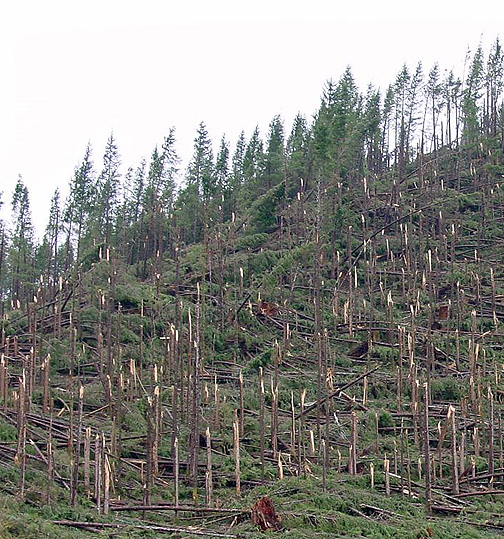
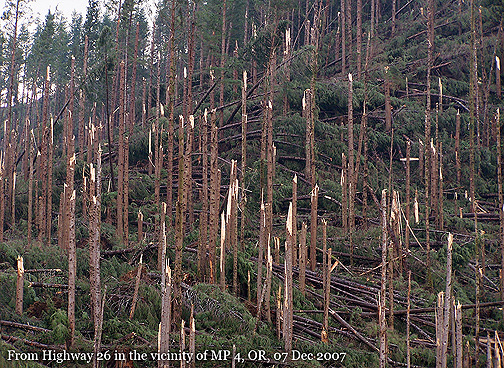
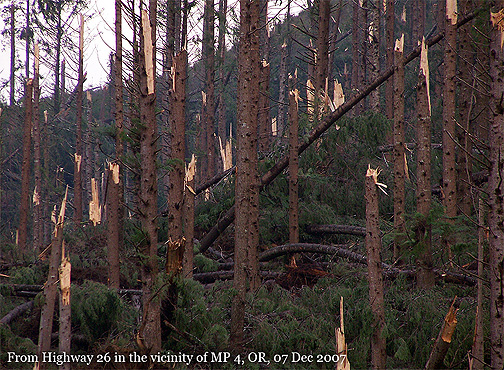
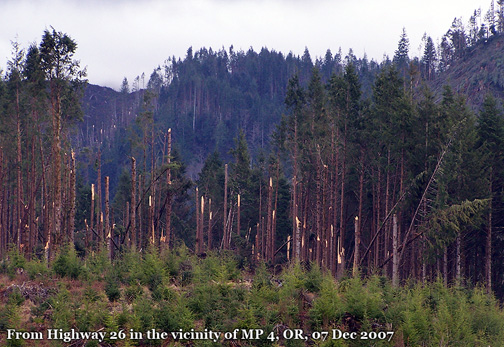
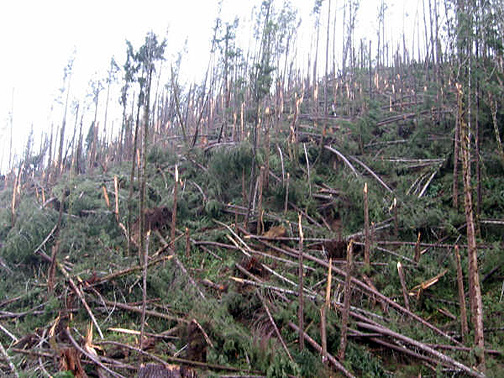
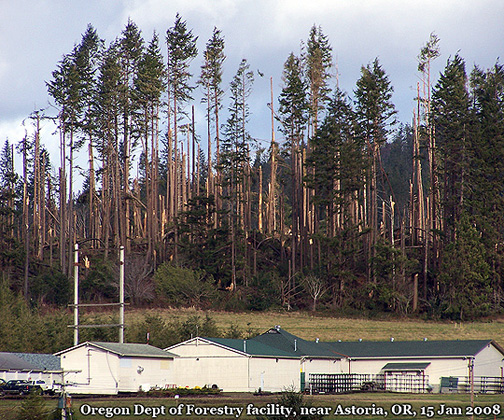
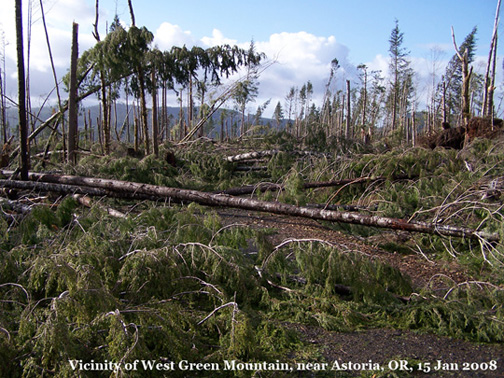
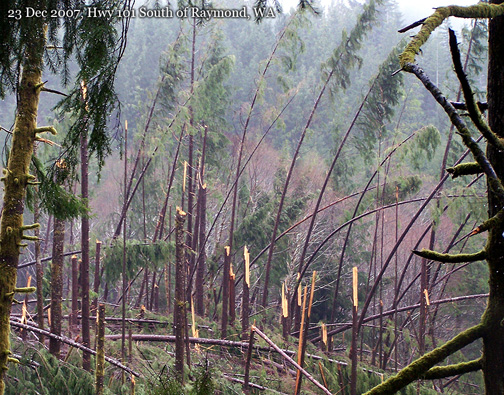
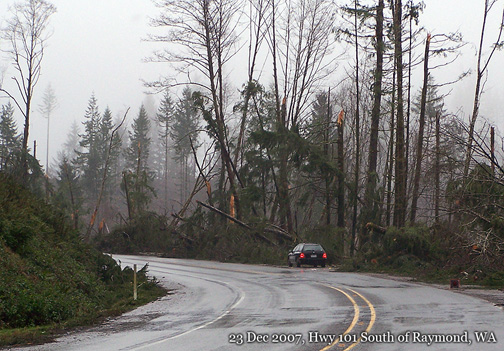
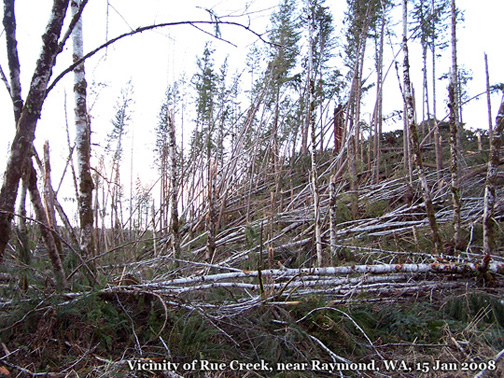
Parts of Lincoln City were still without power both when I drove through northbound, around 12:15 to 12:30 and on my return drive between 18:15 and 18:30. Cars stacked up at the intersections with dead stoplights as they became treated as four-way stops. On my way home, long after the sun had set and a misty darkness had settled over the Pacific shore, the drive through Lincoln City proved quite eerie. Whole sections were nearly pitch black, save for the lights of passing cars and trucks. A few homes and businesses had some working lights, probably generator fed. In the darkest section of town, patrons packed a restaurant with warmly glowing windows to capacity, like moths drawn to a lantern. Darkened stoplights were hard to pick out in the gloom, and I drove very slowly, ready to stop when I finally saw one of the three-eyed heads appear from the nearly black sky. Everyone drove slowly, save one fool in a 4Runner who felt the need to race the engine, and a general sense of emergency hung over the town. Earlier, as I headed north, I saw lines forming at a gas station just north of Depoe Bay. Probably people streaming in from areas that still had the electricity out. Can't operate the gas pumps without the other "precious juice": electrons. In response to the widespread destruction of electricity infrastructure, power crews were out in force putting the system back together. Repair trucks were parked on highway shoulders, in neighborhoods, at service stations, moving to their next destination. In essence, crews were everywhere, working hard. I saw several teams at work in the dark, fixing lines with the aid of truck-borne spotlights. Once, a bight blue flash illuminated the night from a transmission pole that was being examined. States-of-emergency, by the way, were declared for both northwest Oregon and southwest Washington due to the storm. Helicopter and boat rescues were required in some communities inundated with near-record and record floods. A very large flood isolated the little town of Vernonia, and some rescues took place there. The section of I-5 near Chehalis that's under 10 feet of water probably won't open until Thursday at the soonest. Cell phone service was out in Lincoln. Indeed, during the height of the storm with the power out, the roads blocked by a rain of trees and cell service largely lost, the only ham radio communication made it out of the coastal strip. I caught these details, and more, on the radio as I traveled the wind-blasted coast. Based on the presence of debris piles, it appears that a storm surge tide found its way into parts of Rockaway and in the vicinity of Hebo and Cloverdale. The buoys operated by the National Data Buoy Center recorded average wave heights as much as 44 feet, with possible individual waves in the vicinity of 60 to 70 feet. Buoy 46050, Stonewall Banks, just offshore of Newport, and one of my usual check-pionts Buoy 46029, Columbia River Bar, just offshore of Astoria, both broke loose during this major storm and floated free. They continued to send data as their positions shifted. I'm not sure if they've been retrieved yet. Most likely, they wont be returned to their stations until this summer, when the weather calms and the work effort can be scheduled. Which means two critical data-points will be lost for the rest of this strong La Niña winter. A tragedy, but also a reflection of the sheer intensity of the recent windstorm. 23:45 PST. December 6, 2007: Thursday 21:31 PST: (Corvallis, OR) Some further impressions from my tour of the windstorm damage on Tuesday: Low stratus that seemed to clamp onto the mountains, and coastal fog, dominated the weather. Occasionally, a light shower would dapple my windshield with misty drops. Sometimes a heavier fall of rain would soak the landscape. Most of the time, the precipitation seemed barely more than heavy drizzle, oozing from the low, sullen sky. Only rarely would a rent in the cloud reveal clean, blue sky above. Despite these clearings, I never once saw the sun. Only the blue-gray shadow of cloud caressed me, even when I could see a ragged blob of cerulean beauty. The fleeting patches of blue seemed to be a tease. A glimmer of hope among a landscape of shattered trees, ruined structures and tangled wires. As I drove out on Highway 20, into the misty Coast Range and toward a windstorm-ravaged landscape full of unknowns, I saw many rainbows. These were broad, short patches of color, partial bows, not a full arc. More like a low, brilliantly colored sundog. The rainbows seemed to appear at random. Briefly, one would dance over a hillside, glowing cheerfully among dense cloud and curtains of rain. Then, a moment later, that blotch of color would be gone, soon to be replaced by a fuzzy Technicolor shroud that hung over an oak-savannah homestead. As I drove westward, the rainbows continued to shift. Each one marked a location where the sunshine poured through a rent in the cloudscape. Shafts of warmth just out of reach. Always, a cloud sat between me and the sun. As the information on the storm has poured in over the past couple of days, it is becoming ever more obvious that the great gale of December 1-3, 2007 is one for the history books. A truly catastrophic event that, in a number of ways, is quite unprecedented. I've written and received many e-mails from weather-keen friends, more so than for any other storm, a situation that just adds to the eerie feeling about this situation. Add to this the big flood at Chehalis, where I-5 sits under ten feet of water, and there's a distinctive hurricane-Katrina-like feel about our recent windstorm. Thanks to Steve Pierce, we now know that a 129 mph gust was recorded at the Fire Station in Bay City, with a sensor that's about 25 feet off the ground and well exposed to Tillamook Bay. I also recieved an e-mail from personnel who maintain the microwave station on Naselle Ridge forwarded to me by Cliff Mass. Looks like wind gusts reached 140 mph there before the anemometer was destroyed, along with part of the microwave antenna. Some ODOT images of massive windthrow along Highway 26 have started circulating. And Steve Pierce, who's now out at Lincoln City, also took some more. Here's one of his shots:
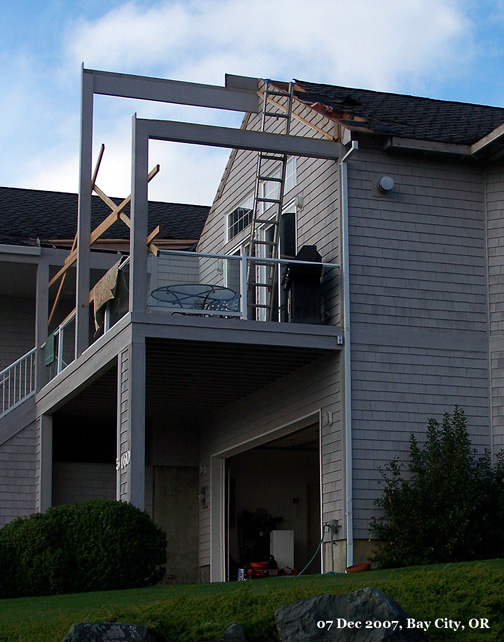
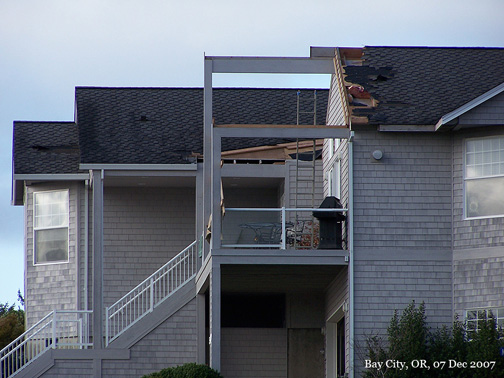
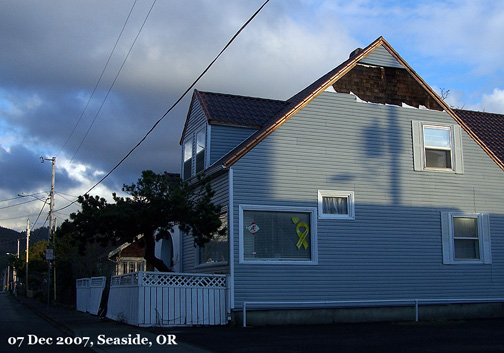
In the photo, there are many stem-breaks. Hundreds. Combined with some root failures, especially on the shoulder of the hill to the left side of the image. Interestingly, after I sent the ODOT image to Steve Mitchell [of the University of British Columbia Faculty of Forestry], he replied that, based on the species and height/diameter ratio, that average winds around 40 mph (say gusts to 60) could have done the damage, if the stand had been previously opened up by a clearcut. This puts a lower bound on the wind velocity at the location of the windthrow. Nevertheless, the damage is spectacular to see. Steve Pierce talked to some of the line crews, and they seemed to suggest that the wind damage happened to be worse in Seaside and Astoria than even in Bay City. I'm thinking about going up to Astoria, or at least Highway 26 where the windthrow is quite visible, tomorrow. Since I need to pick up Kesri in Tigard, I'm slated for a lengthy drive anyway. 22:21 PST. December 10, 2007: Monday 14:42 PST: (Corvallis, OR) My second trip up the coast, this time from Newport all the way up to Seaside, revealed some amazing sights. I found some more structural damage in Bay City:
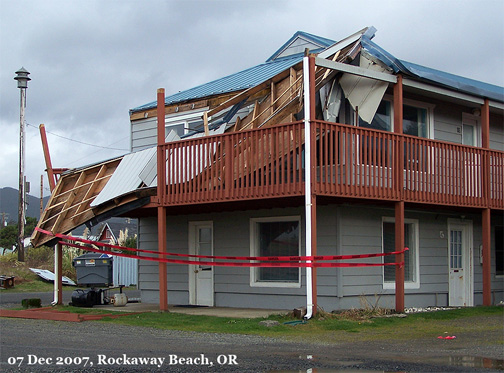
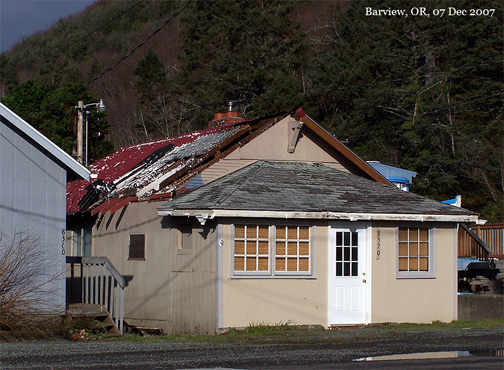
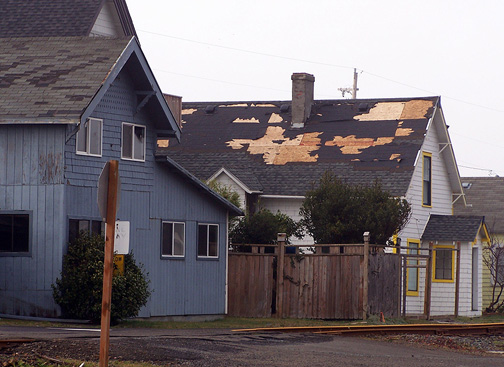
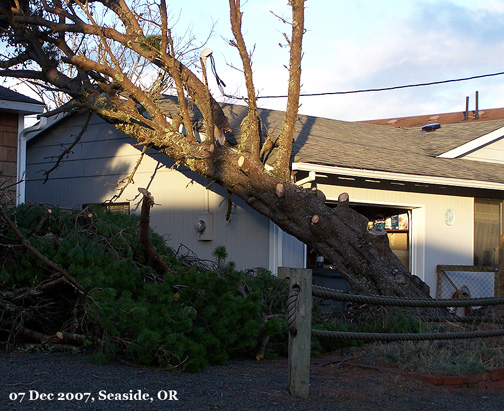
The above home had been built on the hill just to the north of the Bay City Fire House. A gust to 129 mph reportedly occurred at the Fire House. Based on some sleuthing by Steve Pierce and I, the Fire House’s anemometer proved to be a Davis Weather Monitor, with the sensor well exposed to southerly winds. The cups are perhaps a little too close to the roof, and are right along the western edge of the structure, and this may have contributed to higher readings. However, a large percentage of the houses and buildings around the fire station had at least some light damage, usually stripped shingles and in some cases broken windows and minor damage to wood-built portions of homes (usually porches). Here’s a dramatic scene from Rockaway Beach:
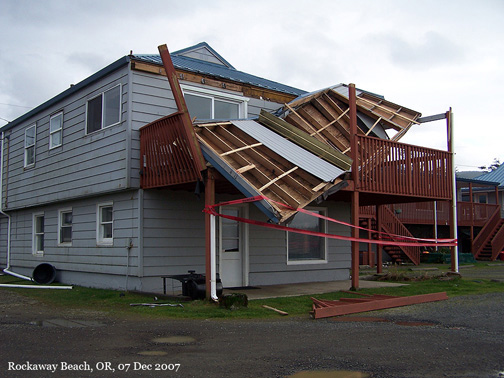
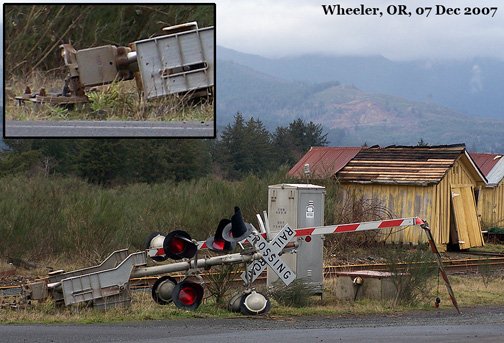
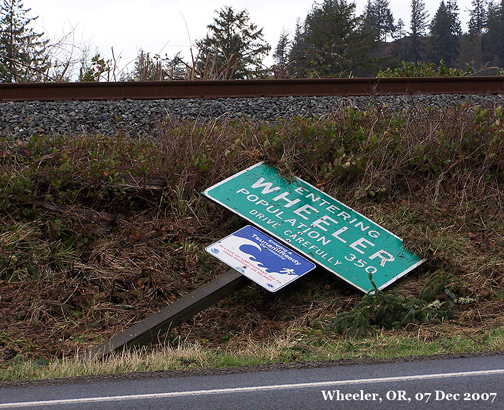
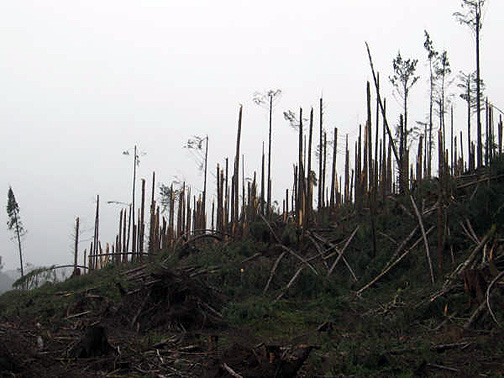
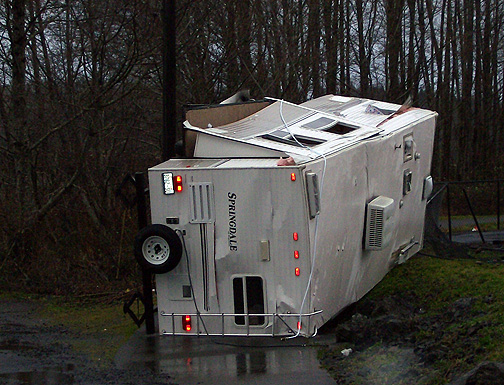
This rockaway photo again shows the more typical type of direct-wind damage when it occurred. Usually weaker or very exposed portions of homes suffered the wrath of the heavy gusts. Clearly wind speeds were just reaching thresholds of structural tolerance in these coastal communities. After Rockaway Beach I slowly rolled through the heavily disrupted communities of Wheeler, Nehalem, and Manzanita. In Wheeler, an entire railroad crossing arm structure had been blown over, right next to a wooden shed that had a distinct cant. Nehalem had some swathing take place right in town, with lots of lodgepole pines snapped. One fell on an old pickup truck. I entered the vast and tall forests of Oswald West State Park. The south end had the usual scattered trees down. By the north end, I caught enough glimpses of heavy tree falls in the thick woods to start getting an ominous sense. Feeling pressed for time, I moved through Cannon Beach fairly quickly, and with the frequency of downed trees increasing I turned east on Highway 26. I knew where I was heading: The Blast Zone, as Steve Pierce called it, about three to five miles inland on the Sunset Highway. I had already seen a number of photos of the damage, but, of course, even as dramatic as the scenes are, they simply don’t reveal the full magnitude of the drama that took place. Much of the heavy windthrow took place on Weyerhaeuser land, and indeed there a harvest was underway, which opened up the stand to a direct broadside attack to the high winds. The managed forest didn’t have a chance. But that doesn’t lessen the sense of power, and chaos created by this windthrow event. Much wind damage made it all the way down into the narrow valley, with broken trees on houses, on a small motorhome, all over the transmission lines along Highway 26 and, before the snapped boles had been cleared away, across the road in many locations. A new house being built, with the lid completed and shingled, lost some of the roof, boards and all. Clearly some very strong wind made it over the hills to the south and southwest and all the way into the valley. That fact was an eye-opener: What appeared to be a fairly sheltered valley reeled under a high-wind attack that clearly matched the gale that scraped through the immediate coast. Almost, it seemed like a deep flood had poured down from the ridges. After I returned to Corvallis, I wrote this e-mail to my weather friends:
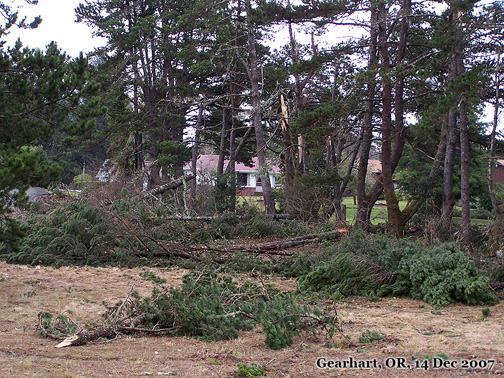
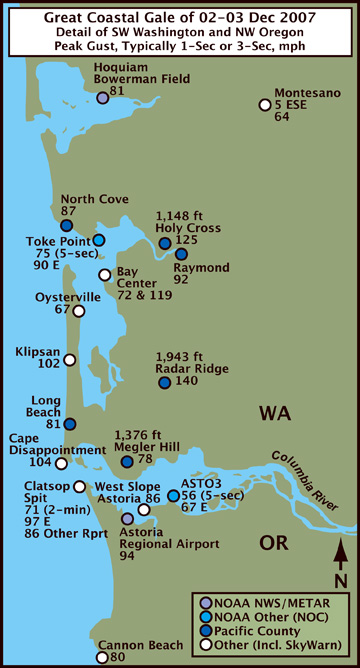
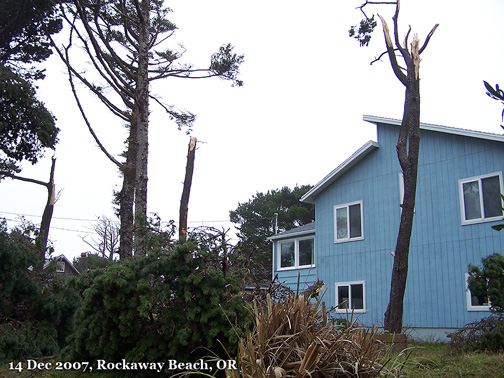
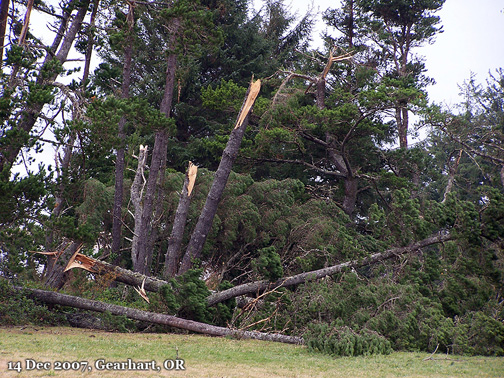
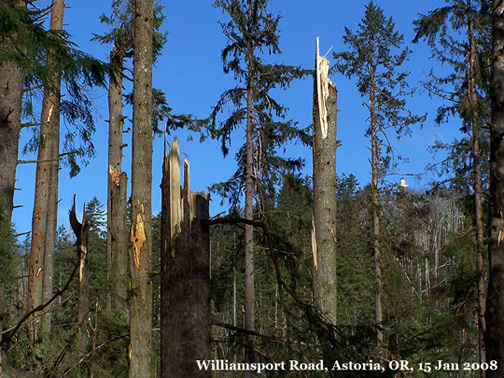
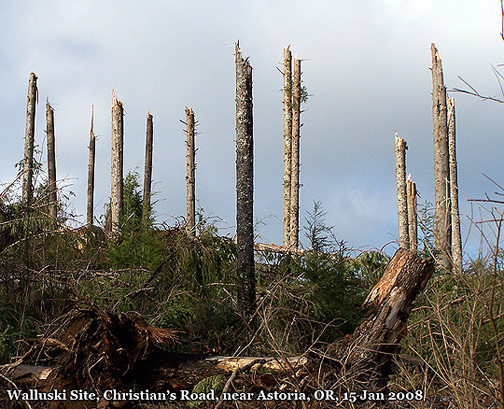
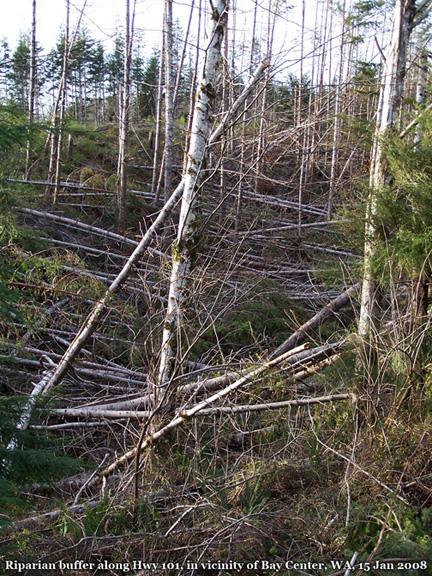
Now, consider all the damage that I’ve commented on for northwest Oregon. As the e-mails about the storm keep arriving, it’s becoming quite clear that southwest Washington may have endured even a more serious blow. I just got an e-mail from Cliff today that a 119 mph gust was recorded on a privately-owned Davis anemometer at Bay Center along the east shores Willapa Bay. Other extreme gusts in Pacific County include 137 mph at Holy Cross and a gust to 140 mph on Naselle ridge that damaged a microwave-relay antenna. Naselle, of course, is favored for high winds. And a NOAA National Ocean Service station at the north end of Willapa Bay recorded a peak 2-minute wind of 54 mph with a peak 5-second gust of 75. This implies shorter-duration gusts in the range of 85 to 90 mph. Not quite the 119 mph noted at Bay Center. It would be interesting to get the specific details on how the sensor is set up at Bay Center, and Holy Cross for that matter. I’m heading up to Seattle on Friday, and plan on taking the coastal route through southwest WA on my way. I’ll have a better sense of the damage after this trip. My tour of Seaside revealed damage quite similar to that experienced from Tillamook northward. Power remained out in parts of that community as I drove through—in the evening of December 7, 2007. Electrical service was being restored in sections. Just when I entered a convienience store with just a few generator-fed lights operating, all the overheads lit up. A power crew worked just down the block. Indeed, the presence of utility crews all over the region was quite impressive. They worked incessantly on restoration activities as I did my survey. In many places, traffic was stopped on the highway as trucks were positioned to fix downed lines and snapped poles. Five counties in northwest Oregon, I believe Lincoln, Tillamook, Clatsop, Columbia and Yamhill were declared Federal Disaster areas, which will help bring in funding for repairs. And Major Disaster was declared for six southwest Washington counties: Pacific, Grays Harbor, Mason, Lewis, Thurston and Kitsap. My sister lives in Kitsap, which was simply inundated by the storm. Her basement flooded. Taking a look at the preliminary F6 climate data, Sea-Tac had 3.77” of rain on December 3rd and 1.55” on the 2nd. The WFO office in Seattle had 4.15” and 1.48” respectively. Olympia had 3.19” and 2.12” and Quillayute had 3.50” and 1.95”. 15:54 PST. December 15, 2007: Saturday 08:13 PST: (Seattle, WA) As with my two previous surveys on the coast, words to describe the widespread and high-frequency destruction that I witnessed are difficult to find. It certainly appears that wind damage is heaviest on the Oregon Coast between Bay City and Astoria, and perhaps the pounding reached a crescendo between Seaside and Astoria. Damage seems to taper just slightly at Astoria, depending on location. Going into Washington, the area at the north end of the Oregon Coast Highway bridge (over the Columbia), say around Megler and McGowan, strangely had much lighter damage. Perhaps this is due to being so directly exposed to Pacific gales (the weak stuff just doesn't last). Tree and structural damage seemed to pick back up around Ilwaco, which suffered similarly to Lincoln City, and then returned to Bay-City-levels around Long Beach. North Seaside and Gearhart suffered a major beating. Widespread broken trees, typically lodgepole pine with a mix of thick-boled Sitka spruce were snapped clean and left in broken heaps across the landscape. Along the shoulders of Highway 101, I saw more that one Sitka spruce that had a diameter-at-breast height of at least a meter broken near ground level. Interestingly, many of the broken pines didn't show any pathological conditions. Broken stems, yanked-off branches, proved to be from healthy trees with no rotten wood. Here's a photo of damage to pine trees:
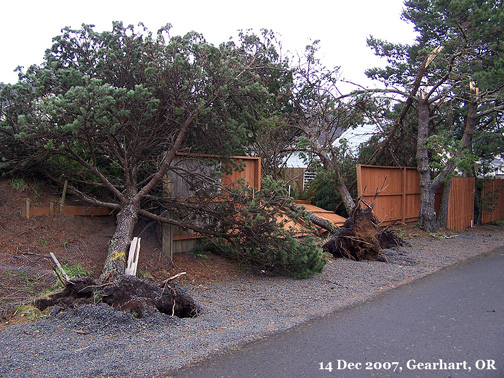
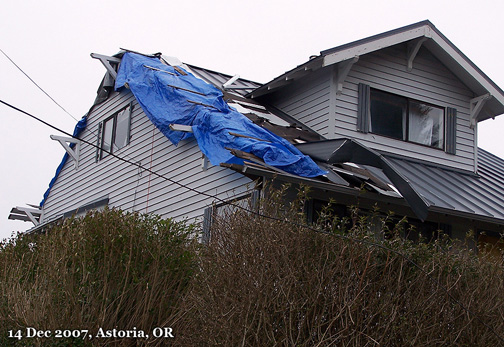
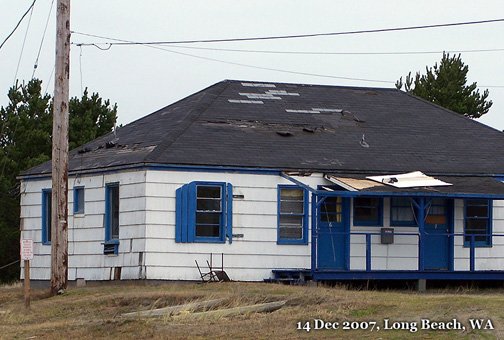
Amazingly, broad patches of willow in some areas showed extensive damage. The short, flexible trees suffered mostly snapped branches, but the breaks were numerous—endemic. Entire groups of trees had a squished, battered feeling, similar to a how a patch of grass appears after it had been stepped-on and the foot removed. Many large trees broke at the Golf Course south of Astoria. Most houses suffered roof damage, the typical shingle loss. Barns and outbuildings everywhere lost sheet-metal lids and siding. At least one large barn building had completely collapsed. I didn't any photos in this area because of much traffic and a desire to get into Astoria and Long Beach before the day waned into night. With all the broken and listing trees, and a general light structural damage, this region of the coast really had the sense of being battered relentlessly by the Northwest's equivalent to a typhoon. Even nearly two weeks after the event, with cleanup well underway, the landscape felt disconcerting and eerie to me. At Astoria, the section of town on the south side of the hill, roof damage proved to be widespread and almost disturbingly common. Whereas, on the more-sheltered north side of the hill, somewhat east down the shores of the Columbia River, little evidence of wind disruption showed. However, areas of the north-facing slope to the extreme west, nearest the Pacific Ocean, were battered considerably. A shot from the south side:
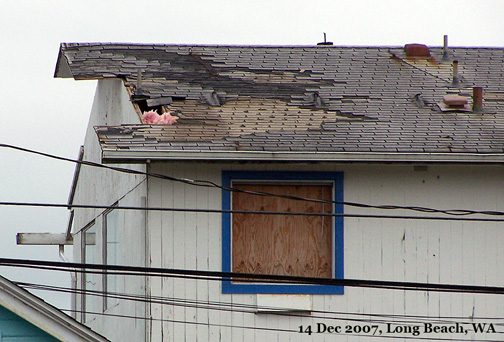
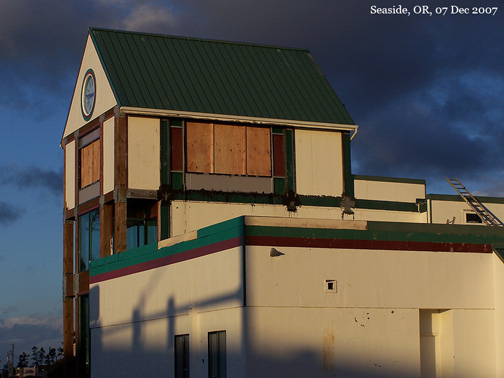
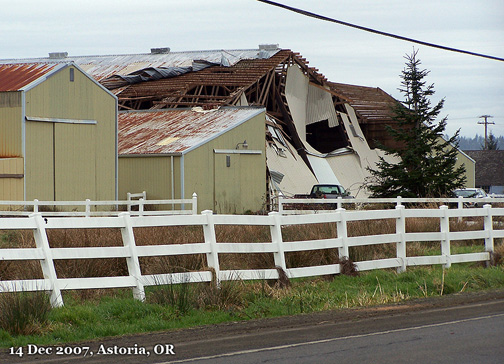
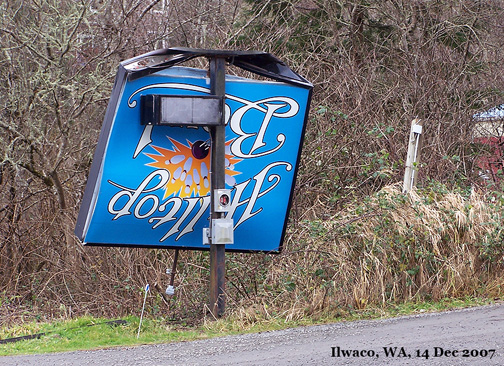
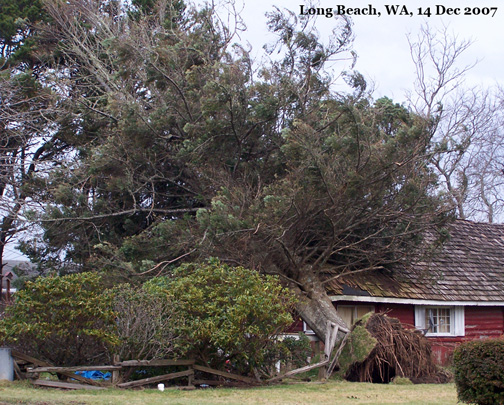
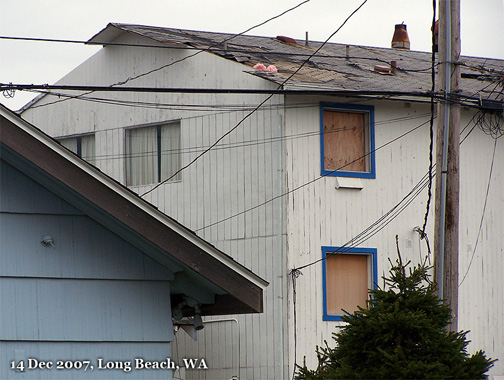
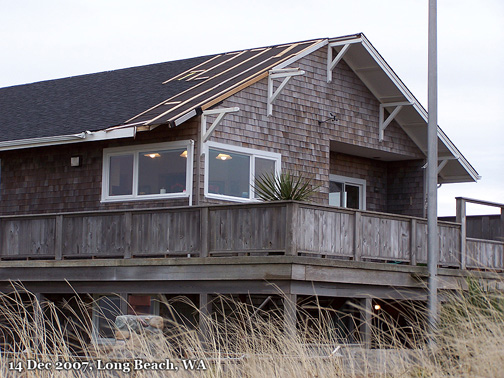
The shattered barn isn't very far from the Astoria Regional Airport and that 85 mph gust. Structural damage such as this occurred all over the area, including broken signs, shattered windows and the all-to-common flattened fencelines. Broken windows were common in parts of downtown Astoria. The roof of the Lamplighter Motel suffered considerable damage, which propagated to the rod-iron rails, and the business signs were broken. Ilwaco and Long Beach both had destruction similar to the north Oregon Coast. Long Beach suffered more than Ilwaco. Many large trees, typically scattered Sitka spruce among numerous pines, were snapped or uprooted in Long Beach... Most had been cleared away by the time of my survey, and all that remains are stumps and root wads, but it's evident that the town has a much more "open" character than before. Many signs were punched out, bent or outright folded over. Some windows broke. Eaves were ripped off, along with parts of roofs (boards and all) in a select few cases, as in the accompanying photo:
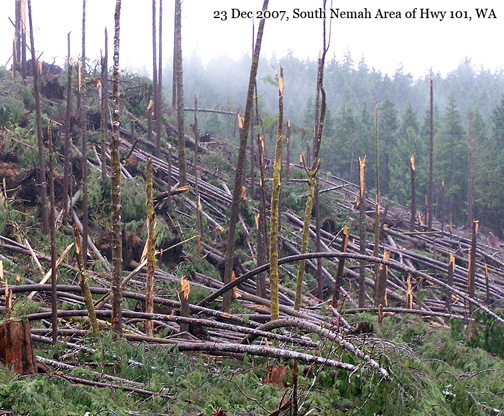
The above Long Beach hotel lost a significant portion of its roof. Indeed, there's so much wreckage on the coast, I could spend weeks there trying to make sense of it all. Especially all the tree disruption. Very interesting local situations resulted from this storm. Small areas of extremely heavy tree breakage--nearly 100% loss--next to nearly unharmed areas perhaps a block away. I've photographed a few of these areas, one of which turned up on a Rockaway Beach neighborhood where nearly all the pines snapped in the gale. I hope to get back to a few of these sites over the next couple of months for a more detailed assessment. An area of particular interest is in the vicinity of Nehalem, Bayside Garden (situated similarly to Bay City: at the north end of a bay) and Manzanita. These communities were right in the middle of some major swathing events. Trees snapped off everywhere, sometimes in long lines. Some areas of pine forest, especially in Manzanita, have a very distinct lean to the north--whole stands. Clearly these trees have suffered considerable root damage, yet remain standing. I think some of these trees have a high chance of toppling this winter as the usual storms sweep ashore. I left Long Beach around 15:45, and the daylight had begun to dim. Reasonable visibility accompanied me as I headed east and then north on Hwy 101 to Raymond, following the east shore of Willapa Bay. From the junction of Hwy 4 and Hwy 101 and continuing northward, areas of windthrow occurred. Nearly all, if not all, were associated with recent clearcuts. A particularly large area of downed trees occurred in the South Nemah area. The frequency of stem breaks, and in some cases shattered Sitka spruce trees of titanic stature, was awesome. I couldn't get any photos due to the low light levels, and a growing rainstorm as a cold front swept toward the coast which added to the gloom. The kinds of structural damage so common to the immediate coastal communities I had toured also proved evident in Raymond, even in the dark. Plenty of missing signs, and some lost sheet-metal roofs. Many broken trees in the vicinity of Raymond, and continuing up to Aberdeen, with areas of windthrow evident in the dark based on piles of trees cut out of Hwy 101 yet still resting on the shoulder. Indeed, the highway had been blocked in numerous places by the windthrow events, which seemed to traverse a SSW to NNE line in most areas. The road must have been closed for some time after the storm. From Aberdeen, I took Hwy 12, then 8, to Olympia. Treefalls were evident on Hwy 12 to about mile post 18. This brief summary doesn't catch everything I saw, but it captures the gist of the damage: The December 1-3, 2007 windstorm was truly an extreme event. The Great Coastal Gale. |
|
December 1-3, 2007 Great Coastal Gale |
||
|
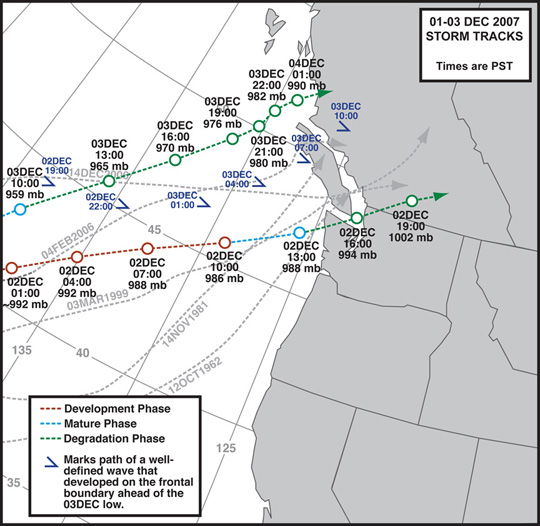
Figure 3: Tracks of the three primary players, two cyclones and one open wave, in the December 1-3, 2007 great coastal gale.
|
||
|
A Major Non-Classical Event |
|
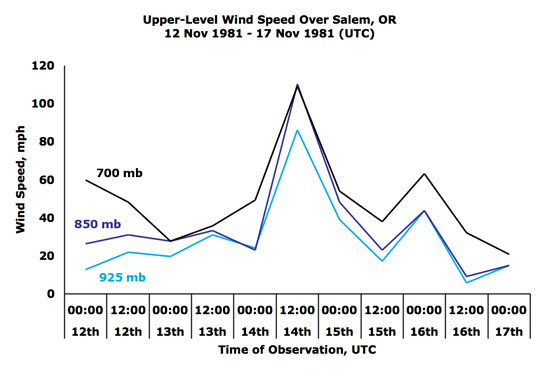
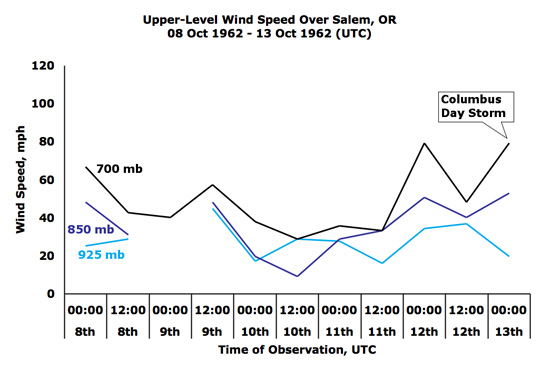
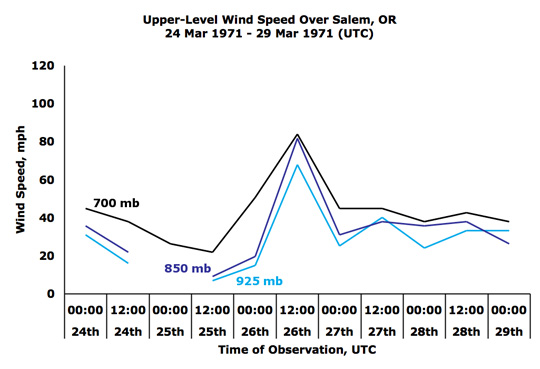
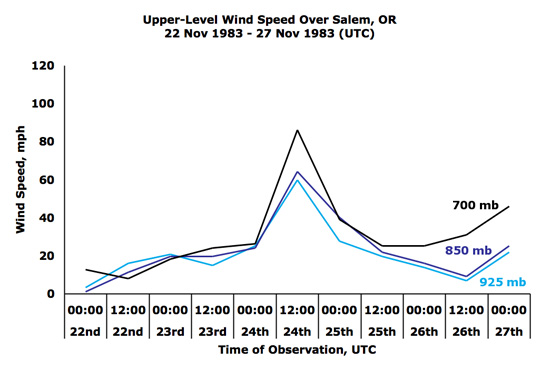
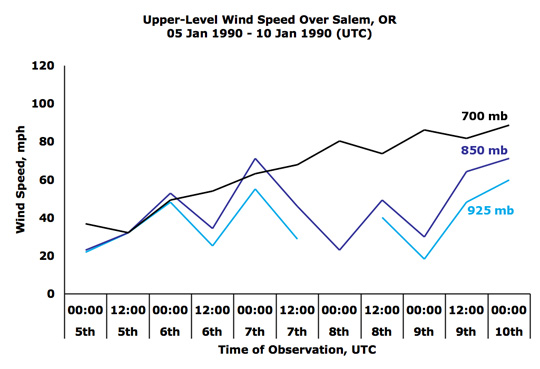
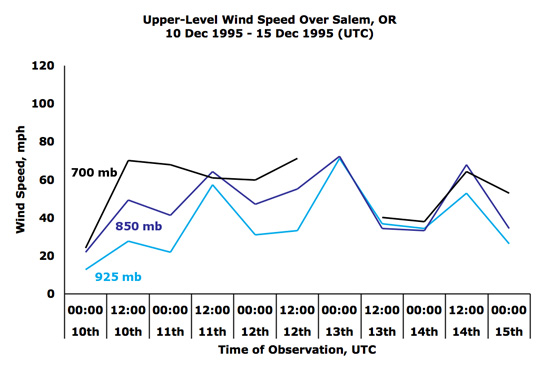
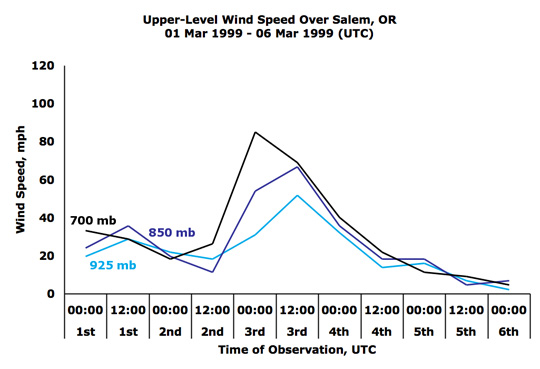
A classical windstorm is an event that roughly parallels the scenario that contributed to the Columbus Day Storm of 1962, and, allowing for some slop in the definition includes storms such as November 14, 1981, December 12, 1995 and January 16, 2000. The term classical event would have to be stretched considerably to include the storms of December 1-3, 2007. Key Points: 1) As shown in Figure 3, above, the primary cyclone tracked west of 130ºW until it had passed north of Vancouver Island. Indeed, the cyclone spent much of its development cycle west of 135ºW. A classic event should be east of 130ºW by the time it reaches the latitude of Astoria, and this makes for a generous definition. 2) The primary cyclone matured far offshore and had significantly degraded (by some 20 mb) by the time it had reached 130ºW. A classic event should be deepening as it crosses 130ºW. Basically, the classical-storm definition exists because, to produce the extreme pressure gradients required for the generation of extreme winds, a cyclone must be quite intense and track quite close to the coast. The simple fact that the December 1-3, 2007 windstorm did not even come close to fitting the classical pattern, while generating wind speeds on the coast not witnessed since 1962, strongly suggests that the event is highly unusual. Indeed, to go somewhat out on a limb, the data point to a new kind of coastal windstorm scenario, one that had not been anticipated before. Yes, December 2007 had the same familiar midlatitude cyclone, though deeper initially than many. And the same frontal systems. And the familiar coastal bias for highest winds. But the event had a different magnitude of outcome. Likely, before December 2007, not a single atmospheric scientists familiar with Pacific Northwest weather would have outlined such a scenario as December 1-3, 2007 if asked to describe the conditions required for an official gust of 94 mph at Astoria. Most likely, they would have looked to the Columbus Day Storm. Looking back in the record, events have occurred that point the way to December 2007. The sequence of events on January 6-9, 1990, especially the final storm of the series, echo December 1-3, 2007 in many ways. The 2007 storm appears to be a much more extreme version, both in wind--especially on the coast--and rainfall. Importantly, given the lack of an equal-magnitude historical event to look too, the fact that the December 1-3, 2007 event was forecast so well points to the great skill of modern numerical computer models and most especially the forecasters. A combination of well-recognized storm categories may help describe the December 1-3, 2007 storm series: There is a small hint of "classical event" in the depth and northeast to north-northeast track of the primary cyclone. However, the mother-of-all "southeast suckers" is a much better analog--the pattern of maximum gusts, including gale-force southeast gusts in the southwest Oregon interior (e.g. Medford), fits the southeast sucker pattern quite well. On top of this, a major "pineapple express" was carried ashore. In short, a degrading super-deep cyclone, combined with a very juicy pineapple express, moved on a southeast sucker path. Somewhat of a mixture of December 12, 1995, January 9, 1990 and November 10, 1983 (or see December 14, 2002). |
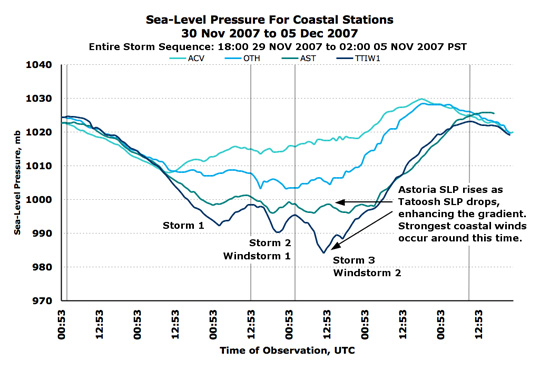
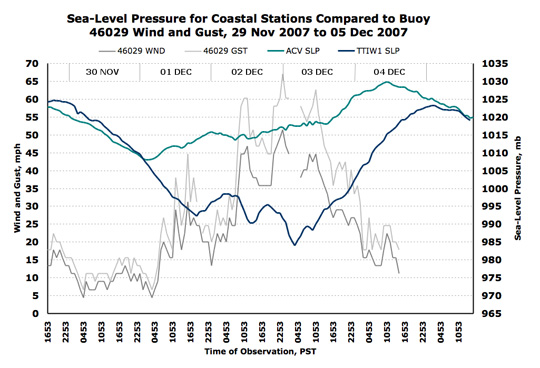
| Figure 4, below, reveals the powerful singature of the deep trough that contributed to the two closely-associated windstorm events. Storm 1 in Figure 3 lead the way with the first dose of rain and some gusty winds, but did not produce the extreme wind speeds that occurred during the following two events, and is not examined closely in the analysis that appears on this webpage. Storm 2 and Storm 3 were the primary players, and are the two cyclones detailed in the Figure 2 map, above. Storm 2 produced the first windstorm, and Storm 3 produced the second windstorm. The open wave that moved inland between Windstorm 1 and Windstorm 2, and marked in Figure 2, doesn't show up strongly in the pressure traces below. In Figure 4, the pressure trend at Arcata, CA (ACV), is very interesting to follow against the pressure readings further north, such as at Tatoosh Island, WA (TTIW1). Arcata's lowest reading during this period of active weather occurred in the morning of December 1st (PST). After that minimum, Arcata's pressure generally trended upward, with a slight drop during the second storm event. As Arcata's barometric readings slowly moved in an upward direction, the sea-level pressure at Tatoosh continued to drop lower with each storm event. This resulted in a very strong pressure gradient along the coast, especially on December 2nd and 3rd (PST). |
|
Figure 4: Sea level pressure, in millibars, at four coastal stations.
|
||
| Figure 5, below, plots the wind and gust at Buoy 46029 against the sea-level pressure readings at Arcata and Tatoosh Island. The connection between the enhanced pressure gradients and wind speed is strongly evident in Figure 5. The first windstorm arrived with a sudden, relatively brief surge of high winds during a time when the pressure fell sharply at Tatoosh Island and the gradient enhanced. Winds slowed somwhat as the cyclone moved into the Olympic peninsula and filled. Then, as the next, bigger, storm system approached, pushing the Tatoosh Island barometric pressure even lower and therefore the coastal gradients even higher, the wind speed picked back up to even higher levels, and lasted for a much longer duration due to the size of the cyclone that generated the second round of extreme wind velocities. During the entire high-wind episode, the pressure trend at Arcata was upward, with some small wiggles downward at times: As each atsmospheric wave moved over Washington, reflected in significant pressure drops at Tatoosh Island, coastal gradients became successively stronger.
Buoy 46029, pounded by extremely high seas with an average wave height up to 44 feet, broke it's mooring on December 3rd. The storm carried the buoy northward along the coast. Thus, the wind record truncates in the afternoon of December 4th. |
|
Figure 5: Sea level pressure in millibars at Arcata, CA (ACV), and Tatoosh Island, WA (TTIW1), compared to 8-minute wind and 5-second gust in miles per hour at Buoy 46029, Columbia River Bar, located offhsore of Astoria, OR.
|
||
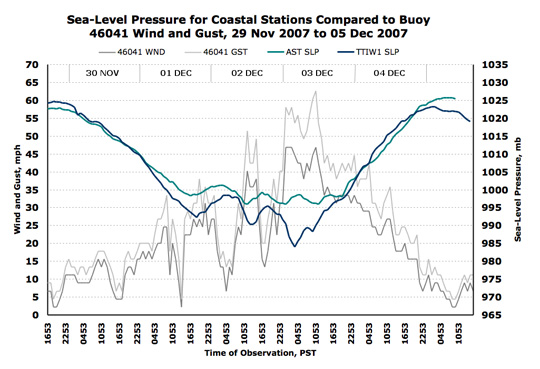
| Figure 6, below, is similar to Figure 5, above, but looks further north and plots the wind and gust at Buoy 46041 against the sea-level pressure readings for more-narrowly-spaced Astoria and Tatoosh Island. The connection between enhanced coastal pressure gradients and wind speed is as strongly evident for this station as it is for Buoy 46029. Some of the fastest winds during the Great Coastal Gale correspond to an interval when the pressure at Astoria rose as the pressure at Tatoosh Island fell. Average seas reached 39 feet at 46041, but the battered station managed to hang on to its mooring and provide a consistent wind record. |
|
Figure 6: Sea level pressure in millibars at Astoria, OR (AST), and Tatoosh Island, WA (TTIW1), compared to 8-minute wind and 5-second gust in miles per hour at Buoy 46041, Cape Elizabeth, located offhsore of Grays Harbor, WA.
|
||
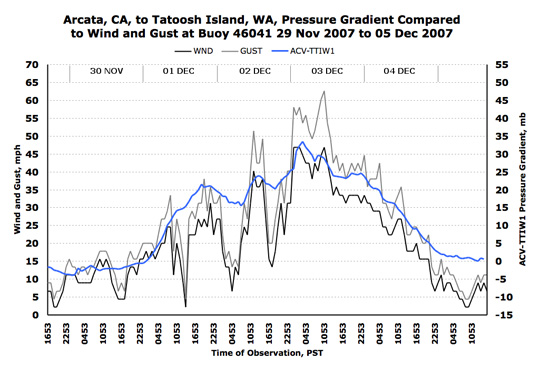
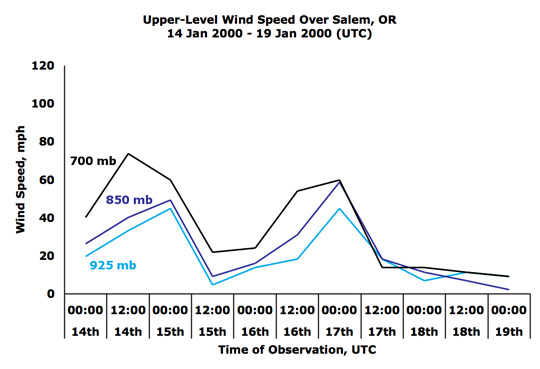
| Figure 7, below, is a more concise means of looking at the information shown in Figure 6, above. Wind speed at Buoy 46041 is directly compared to the ACV-TTIW1 pressure gradient. Spikes in wind speed are neatly associated with spikes in pressure gradient. Between storm events, when the gradient relaxed, wind speed slacked off, sometimes quite dramatically. Pressure gradient is a well-known mechanism for driving wind speed. What is interesting about the Great Coastal Gale of 2007 is that the pressure gradients, though strong, were not extreme. ACV-TTIW1 measures have been stronger in past storms, including the powerful December 14-15, 2006 windstorm, without the extreme wind speeds witnessed along the coast in December 2007. Another mechanism, on top of the sharp gradients, apparently contributed to the Great Coastal Gale: Very fast mid-level winds, a feature examined in another section. |
|
Figure 7: The coastal pressure gradient from ACV (Arcata, CA) to TTIW1 (Tatoosh Island, WA) is compared to 8-minute wind and 5-second gust at Buoy 46041, Cape Elizabeth, located offhsore of Grays Harbor, WA.
|
||
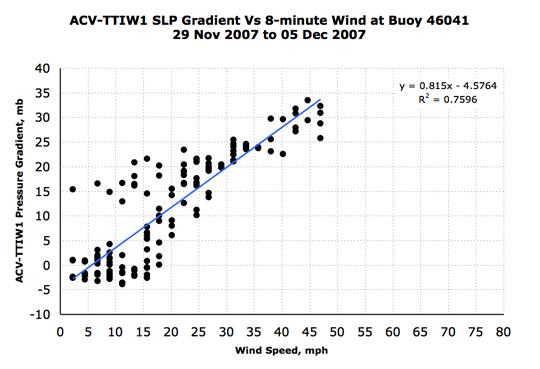
| Figure 8, below, is provided largely for those who are curious about such details. For Buoy 46041, the correlation between 2-minute wind speed and ACV-TTIW1 pressure gradient is quite strong, with an r-squared value of 0.76. The sharp lulls in wind speed between the strong low pressure areas shows up in the scatterplot as a line of low wind readings among moderate gradients of around +10 to +20 mb. |
|
Figure 8: Scatterplot comparing 8-minute wind speed at Buoy 46041 with the ACV-TTIW1 pressure gradient. As might be expected, the relationship is strong though not perfect.
|
||
Table 1, below, lists the maximum pressure gradients for standard measures for the December 2, 2007 windstorm. The maximum gradients for December 2, 2007 windstorm aren't particularly noteworthy. Even the coastal values can be described as moderate. Windstorms with much higher ACV-TTIW1 (approximately equal to ACV-UIL) values have produced lower peak wind speeds. This suggests that the gradients only tell part of the story behind the extreme wind gusts that occurred during the late morning and early afternoon of December 2, 2007.
Table 2, below, lists the maximum pressure gradients for standard measures for the December 2-3, 2007 windstorm. The maximum gradients for December 2-3, 2007 windstorm are strong on the coastal, and moderate for interior measures. The maximum ACV-TTIW1 gradient of +33.5 mb puts this event in the range of the Columbus Day Storm, which produced a maxium of +32.3 mb. For the shorter measure between Astoria and Tatoosh Island, the maximum gradient during the Columbus Day Storm was +17.7 mb. The modest interior gradients during the December 2-3, 2007 windstorm are consistent with the much lower wind speeds east of the coastal mountain ranges. The Columbus Day Storm produced a maximum MFR-EUG gradient of +17.0 mb and PDX-BLI gradient of +17.7 mb, for comparison.
|
|||||||||||||||||||||||||||||||||||||||||||||||||||||||||||||||||||||||||||||||||||||||||||||||||||||||||||||||||||||||||||||||||||||||||||||||||||||||||||||||||||||||||||||||||||||||||||||||||||||||||||||||||||||||||||||||||||||||||||||||||||||||||||||||||||||||||||||||||||||||||||||||||||||||||||||||||||||||||||||||||||||||||||||||||||||||||||||||||||||||||||||||||
|
Newport to Hoquiam: October 1962 vs. December 2007 |
|
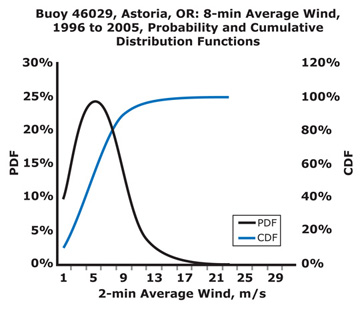
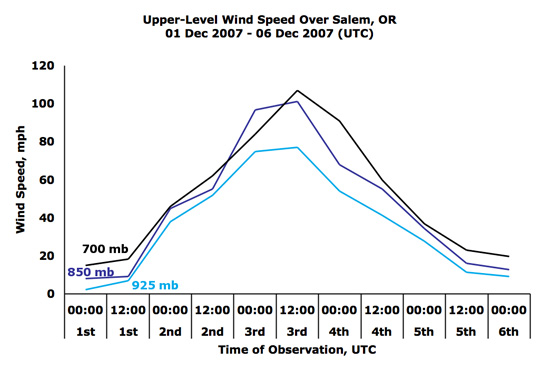
Based on peak wind gusts only, it appears that for a relatively small section of coastline, between approximately Newport, OR, to Hoquiam, WA, the December 02-03, 2007, windstorm was the strongest since the Columbus Day Storm. In that region, the station with perhaps the best wind record is Astoria. Table 4, below, provides a sampling of peak gusts from high-wind events at AST:
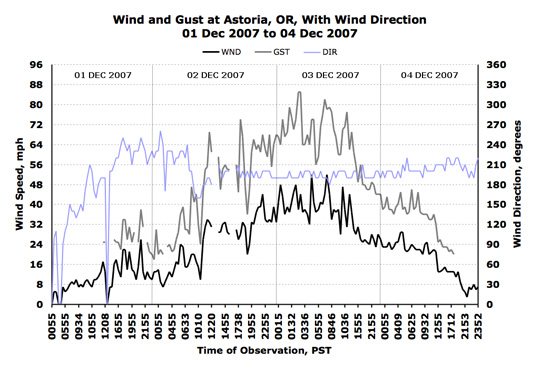
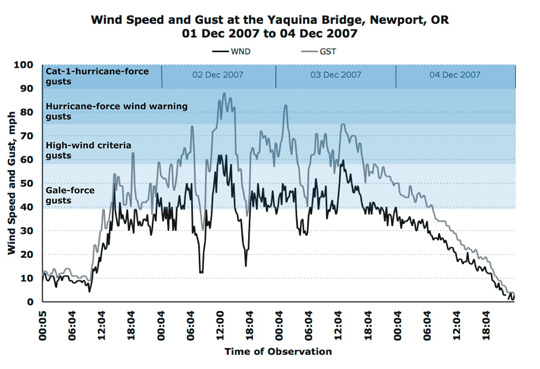
Note the rarity of events in the 80-mph-plus category, and one of those (Dec 2006) is adjusted from the 69 mph 5-sec gust, and in actuality the peak 3-sec value may not be this high. Figure 9, below, graphs the wind data for Buoy 46029, and shows the probability distribution function (PDF) and cumulitive distribution function (CDF). Notice that, above a certain velocity that has the greatest liklihood of occurrence, the frequency of a given wind speed drops off rapidly, forming a long tail. The gaphic is for 8-minute wind. Likely, peak gusts follow a similar distribution. Though, as with the sampling of data for Astoria in Table 1, it could be surmised that, when specific types of events are focused upon thereby limiting the scope of potential wind speed, a neat distribution like the one in Figure 1 may be an unrealistic expectation. What this information suggests is that an 94 mph gust at Astoria is, 1) a highly unusual occurrence, 2) is likely the highest wind gust at this location since the Columbus Day Storm. Given the long right-hand tail (skewed distribution), if the 2 mph difference between the peak gusts of 2007 and 1962 were significant relative to the resolution of the wind measuring equipment, which is likely not the case, then that difference--96 vs 94--would actually be significant. The record for Newport is a little fuzzier. The 138 mph peak gust in 1962 was not taken at the airport, and was observed from an instrument at the City Hall building (I believe). From the available data, however, the peak gust of 83 mph on 02 Dec 2007 is the highest since 1962. Indeed, it appears that this is the first time a gust at ONP has exceeded 80 mph since 1962. For Hoquiam, there's a four-way tie based on peak gusts: All these storms produced a peak gust of 81 mph (70 knots) at Hoquiam: November 3, 1958, October 12, 1962, November 24, 1983, and now December 1-3, 2007. Of course, Hoquiam suffered data interruption (probably due to power loss) right after the 81 mph peak in 2007, so the actual peak gust could have been higher. This is also true for the ONP readings for 02-03 Dec 2007. Based on the above assessment, December 1-3, 2007 was a very significant event with the fastest wind speeds in 45 years. As defined by maximum wind speeds, this storm was likely the strongest since Columbus Day 1962 for a narrow strip of coast from Newpoer to Hoquiam and perhaps 10 to 20 miles inland. Data Interruptions at Key NWS Stations: Actual Peak Gusts? Peak Gust at Newport (KONP), OR Before experiencing a data outage, the highest wind report from Newport occurred during the first storm at 12:32 PST on December 2, 2007 with an amazing reading of SSW 58 mph gusting 83. The last report before the outage, at 13:52, showed winds at SSW 47 mph gusting 61, continuing a diminishing trend in wind speed in the regular 20-minute observations at KONP. Wind reports at the Newport Airport resumed at 11:13 on December 3, 2007 with a value of SSW 37 mph gusting 47. Based on information from stations that continued operating, winds from the second windstorm started to escalate during the timeframe of this data-hole, say starting from 06:00 on December 3rd. The question then becomes, were the wind speeds at the beginning of the second windstorm stronger than the first? Likely, not. Support for this assertion comes from the available record at the Yaquina Bridge. At this well-exposed location, maximum wind during the first storm reached SW 62 mph at 11:34 on December 2nd, with this value being equaled at 12:19 and 13:19. A peak gust of 88 mph was noted in the 12:49 and 13:04 observations. During the second storm, SW winds reached 60 mph at 13:04 on December 3rd, and a peak gust of 75 mph occurred at the same time, and is also indicated in the observations at 12:49 and 13:19 (There were higher gusts earlier, between 01:00 and 02:00, reaching 83 mph, but 2-minute average wind speed stayed well below 60 mph--this is discussed in the next paragraph). These Yaquina Bridge wind reports overlap with the available record at the Newport Airport, because observations resumed at 11:13, about two hours before the second storm's peak winds as indicated at the Yaquina Bridge. At KONP, winds were SW 37 mph gusting 58 at 12:51, SSW 44 mph gusting 59 at 13:31 and SSW 41 mph gusting 61 at 13:31. Between the 11:13 and 17:13 observations, which contain the highest winds in the available record for the Newport Airport, the peak wind was 44 mph and peak gust 61. Not even close to the 58 mph gusting 83 from the first storm. Looking at the Yaquina Bridge during the timeframe of the 13:52 December 2nd to 11:13 December 3rd data blackout at KONP reveals a continuation of diminishing winds from the initial storm during the afternoon and evening of the 2nd. The low point is between about 17:00 and 18:00 where wind speed drops to about 28 to 30 mph with gusts around 40 to 47. After 18:00, the wind gradually gains speed as the second storm approaches. Between 23:49 on the 2nd and 03:19 on 3rd, the wind reaches a second high point, with 2-minute averages between 40 and 50 mph and many of those ranging from 44 to 48 mph. Gusts reached as high as 83 mph during the 01:19 and 01:34 observations. It is during this time period that KONP may have experienced wind gusts approaching those of the first storm, but given that the max gusts on the bridge were 83 mph, which matches the KONP peak at 12:32 on the 2nd, likely the gusts at the airport were below 83 mph. Based on the above record, and taking into consideration the peak gusts of 88 mph at the Yaquina Bridge, as well as a peak of 82 mph at the National Data Buoy Center's station NWPO3, the peak gust of 83 mph at Newport is likely the maximum gust during the entire two-storm event. This is far below the 138 mph gust recorded during the Columbus Day Storm of 1962--note that this reading was not taken at the airport. The peak gust at the Newport Airport is, therefore, likely below the maximum for the Columbus Day Storm but nevertheless stands as the highest official gust in 45 years. Peak Gust at Astoria (KAST), OR During the protracted two-storm event, the official weather station at the Astoria Regional Airport suffered periodic short-term data interruptions. Initially these involved only some of the meteorological variables that the station typically reports, with wind being among those that ceased. The final data outage ended up being the longest, and terminated the reporting of all instruments. The first two wind-data outages occurred during the leading storm event. Outage one happened between reports at 12:20 and 14:14 PST on December 2, 2007, and outage two occurred between 15:55 and 17:26 on the 2nd. Regular reporting then continued as the second, more protracted, windstorm gained momentum. Before outage three, Astoria's last standard observation occurred at 03:55 on December 3, 2007, while the winds were raging: SSW 36 mph gusting 68, and this only about an hour after the reported peak gust of 85 mph at 02:47. One special observation occurred at 04:03, with winds at SSW 32 mph gusting 64. Then silence. The Astoria ASOS didn't report again until 16:55 on December 5, 2007. Fortunately, the Astoria ASOS station was tied to the Coast Guard Station emergency generator, and data continued to be collected in memory during the communications outages that prevented the observations from being reported on the METAR network. When communications were restored, the store information was sent to the National Climatic Data Center (NCDC). Thanks to Tyree Wilde of NWS, Portland, the information is made available here. The highest gust in the standard reports proved to be the 85 mph burst that registered about an hour before the long data outage. Interestingly, maximum 2-minute winds climbed higher during the outage period than reported before the data blackout even though gusts did not quite reach the pre-outage peaks. Before the outage, 2-minute wind reached 48 mph at 00:28 on the 3rd and again at 02:20. After the outage, on two occasions the 2-minute wind climbed to 52 mph: at 04:53 accompanied by a 74 mph gust, and at 07:55 accompanied by a 78 mph gust. After the 85 mph gust at 02:47, the wind only broke 80 mph one more time, with a burst to 82 mph at 07:39. During the second storm, wind gusts of 69 mph (60-knots) and higher occurred between 00:37 and 12:55 on the 3rd, twelve hours of serious punishment with many gusts in the range of 70 to 79 mph. The record presented in Figure 10 is not quite complete, for it does not incorporate informaiton from additional comments, like "PK WND", in the reports. In the NCDC publication Local Climatological Data for December 2007, the final figures for the windstorm are revealed: A maximum 2-minute wind of 55 mph and 3-second gust of 94 mph on December 3rd. Likely, the values occurred in the early morning hours, probably around the time of the 85 mph gusts noted in the figure.
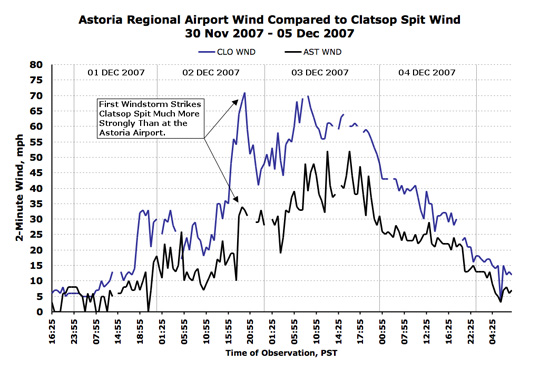
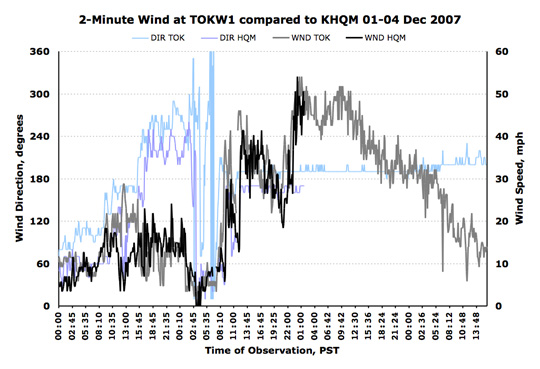
Data from Clatsop Spit (CLO), shown in Figure 11, below, located about six miles to the northwest of the Astoria Regional Airport and exposed to the brunt of Pacific gales, reveals a striking different in peak wind speed between the two locations during the first storm. Winds generally run higher for CLO: On average during the storm interval, 2-minute wind speeds at AST were about 62% that of CLO. However, during the first storm, CLO winds surged far higher than those at AST, racing along at almost twice the speed. This translates to four times the force. Winds at Astoria certainly escalated during the first storm, but failed to surge in the manner apparent at Clatsop. During the longer second storm, AST winds followed more closely in line with CLO, allowing for some strong variability at Astoria. The differential response to the first storm suggests some differences in the nature of the two windstorm events. Wind direction for the first storm had a tendency to be 170 to 190 degrees, whereas winds during the second storm tended to be from 190 to 210 degrees. This subtle difference in direction may have been enough to account for the disparity in wind speed response between the two stations.
Peak Gust at Hoquiam (KHQM), WA Unlike the case for Newport, due to the early outage of Hoquiam's ASOS reports relative to the timeframe of the storm's maximum winds, the peak gust of 81 mph reported for HQM is much more likely to be low. During the height of the storm, the last regular observation for Hoquiam, WA, happened at 00:53 on 03 Dec 2007, with S winds at 49 mph gusting 81, with the peak gust of 81 mph having occurred at 00:47. High-resolution data for Hoquiam are graphed in Figure 12, below. At this station, south winds escalated around 23:22 with a report of 40 mph gusting 55. The observation before this, at 23:09, shows S winds of 29 mph gusting 41, so a marked change in wind speed occurred in the 13 minutes between observations--the main event had begun by 23:22. From that point, average winds generally remained 40 mph and above up to the last observation during the gale. At 00:10, the highest 2-minute wind for HQM occurred, with a value of SSE 54 mph, accompanied by a gust to 75. However, the 48 mph 2-minute wind at the final 01:40 report isn't very far short of 54 mph, and a gust of 76 mph occurred during the 01:30 observation, both reflecting a storm going near full-steam at the time transmissions stop. The windstorm had only been going strong for about 2.5 hours before the official station at Hoquiam ceased reporting, and powerful gusts would continue for many more hours.
A station operated by NOAA's National Ocean Service, located at Toke Point along the north end of Willapa Bay approximately 20 miles SSW of Hoquiam, continued to report wind data throughout the windstorm. Data for Toke Point and Hoquiam are graphed side-by-side in Figure 13, below. Looking at reports close to the times of the above Hoquiam observations: At 23:24 on 02 Dec 2007, S winds were blowing at 46 mph gusting 59, with a maximum gust of 65 around 23:06. Winds escalated significantly at this station after 22:36, so Toke Point was about an hour ahead of Hoquiam. The 00:54 report for 03 Dec 2007 from Toke Point showed S winds of 49 mph gusting 64, with maximum winds in the past hour at 54 mph gusting 71 around 00:42. Note that the gusts are 5-second averages, whereas the gusts at Hoquiam were 3-second averages on a very sensitive sonic anemometer, which means that Hoquiam's gusts tend to be higher relative to the 2-minute wind than Toke Point's. A 71 mph 5-second gust might be expected to contain shorter-duration gusts like those recorded at Hoquiam of 80 to 85 mph. After 01:40, Hoquiam reported 48 mph gusting 64, and then the data ceased, while the transmissions from Toke Point continued. At 01:42, Toke Point registered 49 mph gusting 75. Figure 12, below, compares the wind observations from the two stations.
The 01:42 observation proved to contain the maximum gust at Toke Point. With a 5-second velocity of 75 mph, possible gusts of shorter duration could have reached 85 to 90 mph at this moment. Note that Hoquiam appeared to be about an hour behind Toke Point, at least for the high-wind initiation phase. Sometime between 02:00 and 03:00, the maximum gust for this storm may have been attained at Hoquiam, though it is possible that the 81 mph could have captured the highest value. Given that 2-minute wind speeds at both locations appear to have been in close agreement, it is not out of the question to use Toke Point's 2-minute wind readings as a proxy for Hoquiam. Among many high readings, Toke Point had 2-minute winds of 51 mph at 01:48, 52 mph at 02:06 and 51 mph at 02:30. Given this reality, it is possible that Hoquiam's peak 5-second gust could have fallen in the range of Toke Point's 75 mph any time during the two hours that followed the transmission outage. Which means that, had the HQM station continued to send reports, peak gusts in the range of about 80 to 90 mph might have been indicated in the missing 01:53 and 02:53 regular observations. Even if 82 mph is taken for the possible maximum gust at HQM in the early morning of December 3, 2007, the Columbus Day Storm's peak of 81 mph is beat. Also, 2-minute winds at Toke Point ranged between 44 and 52 mph up to 04:12 before the first signs of a waning in velocities shows. That is, from 22:54 on 02 Dec to 04:12 on 03 Dec, 2-minute winds blew in the range of 44 to 54 mph. Five-second gusts ranged from 56 to 75 mph during this five-hour timeframe. However, even with a slight lull down to a 2-minute average of 39 mph at 05:06, the winds returned with nearly the same force as before and for the period 07:42 to 10:42, winds raged at 44 to 52 mph with 5-second gusts as high as 70 mph. After a 10:54 observation of S 51 mph gusting 68, winds began a long, but steady reduction. This not only informs about the long duration of high winds in southwest Washington, but also the fact that, after that final report from Hoquiam at 01:40, the potential for brief (3-sec) wind gusts in excess of 80 mph persisted for about ten hours. Ultimately, what the Toke Point data indicates is that Hoquiam's peak gust of 81 mph could be on the low side. However, it is probably only down by a few mph. My estimate is that Hoquiam's peak gust was between 81 mph and the peak gust at Astoria, 94 mph, perhaps 85-90 mph. In terms of raw wind speed, this means that, for the Hoquiam area, the December 01-03, 2007 windstorm was likely stronger than the Columbus Day Storm of 1962. |
|||||||||||||||||||||||||||||||||||||||||||||||||||||||||||||||||||||||||||||||||
|
Unusually High Wind Gusts Combined With the Storm's Long Duration: |
| It is important to understand that, even though the peak gusts during the December 1-3, 2007 windstorm may have been short of the Columbus Day Storm at many official stations, they were nevertheless very powerful. A gust of 94 mph at Astoria puts the storm in the number two slot for that location, and 94 mph can inflict much damage, especially to trees and poorly-built structures. Now, add to the extreme peak gust speeds an incredibly long period with gale-force-plus wind gusts, and it looks like the December 2007 great coastal gale is an unprecedented event.
Clatsop Spit, OR, remained in the range of 55 mph to 70 mph between 21:25 on 02 Dec and 12:55 on 03 Dec. Fifteen hours straight of average winds that, if they were merely gusts in the Willamette Valley (G 55 to 70) for that 15-hour duration would have resulted in a catastrophic inland storm. Given the heavy rain, it appears that a midlatitude "typhoon" struck the coast. The duration of the December 1-3, 2007 storm is key to understanding the level of damage in the region. The disruption may have exceeded the Columbus Day Storm at Astoria due to the very prolonged wind attack. For a more detailed glimpse at how long the December 2007 windstorm lasted, take the ODOT station on the Yaquina Bridge in Newport, OR, which reported continuously throughout the storm, as an example. Data for the Yaquina bridge are depicted in Figure 14, blow. Peak gust at the bridge reached 88 mph, not too much higher than the 83 mph at the airport and suggesting a well-calibrated anemometer. Table 5, below, lists the times that specific categories of wind gust occurred at the Yaquina Bridge. The calculated duration should be considered a rough approximation that is biased toward higher values than reality, for some lulls in wind speed due to the approach and passage of separate waves are ignored in a non-systematic way for this quick examination.
The Yaquina Bay Bridge endured nearly two days of high-wind-criteria (58-mph-plus) gusts, all clustered in a closely-associated double-storm event. This is an amazing value, especially given that most windstorms seem to last for 2 to 6 hours, and "long" events are generally around 8 to 12 hours. In the case of duration of high wind, December 01-03, 2007 sets a whole new standard.
|
|||||||||||||||||||||||
|
Locally Extreme Wind Speeds |
A wide range of peak gusts were recorded during the storm, sometimes over small spatial scales. Many of the differences can be explained by terrain factors, such as an anemometer location near a long overwater fetch, or a wind sensor being located on a well-exposed ridgetop. Figure 15, below, outlines the idea of fetch. Other factors can also explain wide differences in measured speed between locations, such as sensor height above ground level, the make or type of anemometer being used, the maintenance of the measuring equipment, and the presence or absence of local obstructions such as structures and trees. Gusts are also a measure of turbulence, and there's a random component to where the fastest bursts strike. In summary, wind measurements are very sensitive to local conditions and are subject to a level of random variation. This often results in a wide array of reported peak wind speeds during windstorms.
Figure 16, below, takes a close look at winds in southwest Washington. John Dunsmoor of Pacific County kindly supplied the data from various microwave sites, marked on the map with dark blue dots. Apparently there has been some controversy over a few of the extreme numbers measured in Pacific County. The gust of 140 mph at Radar Ridge is incredible, as is the peak of 125 mph at Holy Cross. However, the values don't seem to be out of line with readings from other sources, such as a gust of 125 mph from a sensor that's 70 feet above ground level on a low coastal ridge in Lincoln City, OR, and the well-repeated (on this webpage ;o) gust of 129 mph clocked at a low-elevation, but well-exposed, site in Bay City, OR. Indeed, the 140 mph gust measured in Pacific County fits within a limited historical context. The November 3, 1958 windstorm produced a peak gust of 81 mph at Hoquiam, and a gust of 161 mph at the long-gone Naselle radar site (Radar Ridge). Naselle, like Mt. Hebo in Oregon, is a high-elevation site known for extreme winds. Holy Cross, like Radar Ridge, is also a high-elevation site (relatively speaking). The gust of 92 mph at Raymond, and 87 mph at North Cove were measured on well-exposed sensors that are 100 feet above ground level. Sensors at standard elevation, 10 meters (33 feet), probably would have had somewhat lower gust speeds.
The Pacific County stations also recorded 24-hour average wind data. Some readings for the entire day of December 3rd are shown in Table 6, below. The anemometer on Radar Ridge was destroyed early on the 3rd, and the 24-hour reading is from the day before--December 2nd readings at the other stations were lower than the December 3rd readings. For example, Holy Cross had a 32 mph 24-hr wind on December 2nd. Likely, the 24-hour wind at Radar Ridge was even higher on December 3rd than the 59 mph measurement at Holy Cross. Trees are put under incredible strain as winds approach 60 mph. At Holy Cross, as measured on a sensor that's 40 feet above ground level, winds averaged near 60 mph for an entire day! With a long pulse of forceful wind speeds such as measured on these sensors, it is no surprise that forests suffered the loss of so many trees.
|
|||||||||||||||||||||
|
Powerful Upper-Level Winds |
| The extreme upper-level winds that accompanied the double windstorms of December 1-3, 2007 were briefly mentioned in the weather-journal entries above. Given the magnitude, about five standard deviations outside of normal (as mentioned by NWS, Portland), they warrant a more detailed examination.
Upper-air soundings are generally done twice a day from select stations. The balloon takes some time to reach maximum altitude, and the data reports from the surface to the upper atmosphere are typically spread out over about an hour. The balloon launch is typically done an hour before the nominal report time. These realities of upper-sounding procedure limit the resolution of the data, and makes storm-by-storm comparisons rather challenging. These limitations should be kept in mind. Salem, OR, has a long record of upper-soundings, and has been in ground-zero of many major storms of history. Focus will be on this station. For those interested, much of the data used here can be found via an upper-air soundings webpage maintained by the Department of Atmospheric Science, affiliated with the College of Engineering at the University of Wyoming. Many thanks to Cliff Mass and Neal Johnson, of the University of Washington Department of Atmospheric Sciences for their efforts in providing upper-air data for pre-1973 windstorms. Figured 16, below, shows three levels of upper winds taken from the Salem, OR, sounding from December 1-6, 2007 (UTC). Of particular interest are the 850 mb (H850) winds, which approached 100 mph around 04:00 PST on December 3rd. Just one kilometer above the capitol of Oregon, winds screamed along at Category-2-hurricane speeds. If a good mixing source, such as a strong frontal boundary, had been present, some serious wind gusts might have been carried to the surface. The direction of these H850 winds, around 205 degrees, did not perfectly align with the Willamette Valley, another strike against the potential for extreme winds in the Valley. And, of course, surface pressure gradients did not reach extreme levels in the Valley region during this particular storm series, with a maximum EUG-PDX of +3.4 mb, pretty typical for a winter storm. Thus, plus-and-minus two hours of the upper-air sounding time, surface wind gusts at Salem were 31-46 mph, out of 170-190 degrees.
There are few windstorms with measured H850 winds comparable to the December 1-3, 2007 storm. A major classical event, November 13-14, 1981, is one such event. Indeed, the H850 winds were somewhat stronger, reaching 110 mph. A fairly well-defined frontal boundary moved through the region around the time of the sounding, 04:00 PST on November 14th--a potential source of vertical mixing. Also, the H850 winds were out of 190 degrees, better oriented with the axis of the Willamette Valley. And surface pressure gradients were at extreme levels, with EUG-PDX reaching +9.2 mb about four hours after the sounding time. The peak gust at Salem reached 71 mph within a +/- two-hour window of the sounding. November 14, 1981 was a near-perfect scenario for high winds in the Valley, with a significant surface response.
Now, to add some perspective on the information from the above two charts. Figure 18, below, depicts the data for the Columbus Day Storm of 1962. Due to the extent of disruption, soundings ceased for a number of days after the event--hence the abrupt cutoff at the time of the storm. The final sounding, taken at 16:00 on October 12, 1962, was just ahead of the extreme winds. Note the H850 winds at a meager 55-60 mph out of the SSE. In less than two hours, Salem would report a 90 mph gust at the surface, out of the south. The Columbus Day Storm carried a well-defined frontal boundary across the Valley, and therefore had a potential mixing source. However, from the perspective of the sounding, the upper-level winds were not particularly extreme. Perhaps, due to the relatively compact and well-organized nature of the cyclone, stronger H850 winds would visit the Salem area over the next few hours--but there are no measurements to support this. Indeed, winds at Medford, a station further to the south and behind the front at the 16:00 PST observation time, were around 60 mph out of the SSW (note that Medford is about 350 m higher in elevation than Salem). The 700 mb winds at these stations were around 80-90 mph--more significant, but still not at the extremes witnessed in 1981 and 2007. The Columbus Day Storm brought a strong surface pressure gradient to the Valley, one comparable to November 14, 1981. After the front moved through, this gradient became well-oriented for a major southerly gale. In essence, the upper wind conditions for the Columbus Day Storm appear to indicate that surface-pressure gradients tend to be the primary driver of maximum winds, at least in the interior section. In other words, the H850 wind speed during the November 14, 1981 storm was of secondary importance, at best, in the determination of peak wind speeds at Salem. H850 wind direction may, in fact, be more important than speed in terms of support for high wind at the surface. In summary: EUG-PDX gradients were of equal magnitude between the 1981 and 1962 storms, the 1981 storm appears to have had much stronger H850 winds (110 mph compared to about 60 mph!), and both storms brought in fairly-well-defined frontal system at an opportune time for extreme winds, yet the Columbus Day Storm produced a peak gust of 90 mph at Salem, OR, verses the November 14, 1981 peak of 71 mph. Very interesting.
The windstorm on March 26, 1971, roughly fits the classic pattern. The upper-wind response, shown in Figure 19, below, looks similar to the November 14, 1981 signature. H850 wind speeds were less, but still fairly strong--indeed stronger than those measured for the Columbus Day Storm. The peak gust at Salem, OR, during the 1971 storm reached 58 mph, with a maximum EUG-PDX gradient of +8.0 mb.
Another event that produced a short spike of fairly strong upper-level winds was the Thanksgiving-Day windstorm of 1983, depicted in Figure 20, below. Maximum H850 winds, noted at 04:00 PST on November 24th, were 63 mph out of 205 degrees--values comparable to the Columbus Day Storm. Peak gust at Salem was 54 mph out of 210 degrees at 07:17 PST, with a maximum EUG-PDX gradient of +10.0 mb. Note a gradient comparable to--if not higher--the Columbus Day Storm and November 14, 1981, yet without the extreme wind gusts of 90 and 71 mph witnessed during the earlier storms. Gradient is not everything, it seems.
The surface response of the January 6-9, 1990 sequence of storms echo the December 1-3, 2007 storm series to a degree. However, the upper-air wind response does not appear to be very close. Of importance, H850 winds were much weaker, and did not progress in a single surge, but waxed and waned with the passage of each significant wave. Max H850 winds were 71 mph out of 220 degrees at 16:00 PST on January 9th. Maximum gust at Salem was 45 mph out of 180 degrees at 13:00 PST on January 9th, with a maximum EUG-PDX gradient of +6.2 mb at 11:00 PST. For the record, winds at all heights had diminished considerably by the 12:00 UTC observation on January 10th, with H850 at 14 mph out of 355 degrees. Interestingly, the H700 winds steadily increased throughout the time period during the 1990 storm series.
The upper-winds for the major windstorm of December 12, 1995, depicted in Figure 22, below, were not particularly outstanding, at least at H850 and compared to the December 1-3, 2007 and November 14, 1981 events. This storm brought a peak "instant" gust of 70 mph (adjusted upward from a 59 mph 5-second gust) out of 180 degrees at Salem, OR, at 13:23 PST on December 12th. This is fairly close in time to the 16:00 PST H850 reading of 72 mph out of 220 degrees. However, the H925 winds are particularly strong at 71 mph out of 200 degrees--the speed is fairly close to the earlier major storms. Indeed, a reading at H944, just 250 m above Salem, had winds at 74 mph out of 200 degrees. The maximum EUG-PDX gradient was +9.1 mb at 16:00 PST, comparable to other major windstorms. H850 winds at Medford at 16:00 on December 12th were 58 mph, and at Quillayute 61 mph.
A couple more windstorm events are included to help demonstrate some rough patterns. The March 3, 1999 windstorm struck western Washington particularly hard, but only delivered a glancing blow to Salem. As with many high-wind events, a strong and discrete escalation of upper-level winds accompanied this storm, depicted in Figure 23, below. Peak gust at Salem was around 55 mph (adjusted upward from a 5-second gust of 46) out of 190 degrees at 00:56 PST on March 3rd, with the maximum EUG-PDX gradient +6.5 mb just an hour later. Maximum H850 winds as measured at 04:00 PST were 67 mph out of 235 degrees.
The January 16, 2000 windstorm followed the classic pattern, but tracked further offshore and had a less-deep central pressure than major events such as November 14, 1981. The upper-level wind response for the January 16, 2000 windstorm is depicted in Figured 24, below. The peak gust at Salem was 71 mph (adjusted upward from a 5-second gust of 60 mph) out of 160 degrees--the SSE direction is somewhat unusual--at 08:11 PST, with a maximum EUG-PDX surface pressure gradient of +6.5 mb. Note the same pressure gradient as the March 3, 1999 storm but with a considerably different wind speed response. Interestingly, maximum H850 winds were at 16:00 PST with a speed of 59 mph out of 225 degrees. Given the relatively low speed of 31 mph out of 215 degrees at 04:00 PST--just four hours ahead of the peak gust at Salem--it is possible that the highest H850 winds occurred between the 12-hourly soundings, the same situation that may have occurred during the Columbus Day Storm. Note however that a scan of the Medford and Quillayute soundings did not reveal H850 winds significantly higher than those at Salem during soundings around the time of the storm.
Upper-Air Winds: Summary and Conclusions Given a wide range of wind responses for specific storm characteristics, it is actually difficult to make concrete conclusions about the information presented. Most likely this is due to the limitations imposed by examining surface and upper-air data from one station, and being restricted to a 12-hour sample rate with soundings. That said, perhaps the best way to look at the situation is that relatively strong surface pressure gradients and relatively strong upper-level winds probably contribute to strong surface winds. Just about every windstorm examined had H850 winds of 50 knots (58 mph) or greater, and most had a EUG-PDX pressure gradient of +6.0 mb and greater. Maybe a probabilistic approach is best: The higher the upper winds, and the higher the pressure gradient, the more likely that damaging winds will occur at the surface. H850 winds in excess of 100 mph do appear to be very rare, with just two instances found in association with a significant windstorm over a span of about 40 years from 1957-2007: November 14, 1981 and December 3, 2007. Figure 25, below, lists the H925, H850 and H700 winds at Salem, OR, for significant Pacific Northwest windstorms, including some that were not examined in the section above. The December 15, 2006 windstorm--a major event for Seattle and other areas--is a respectable 3rd runner-up, with H850 winds of 84 mph, and H700 of 108 mph.
Though the extreme upper-level winds during the December 1-3, 2007 series of storms did not result in near-record gust speeds at Salem, or in fact any interior station, this does not rule out the possibility that such winds had an influence on coastal winds. With the first line of impeding terrain landward--down-range of any wind that has a westerly component to its direction--mid-level wind direction is less critical for an upper contribution to coastal wind speeds. Indeed, wind direction at the surface was often SSW during the gale, in rough alignment with the observed H850 direction at Salem. Maximum pressure gradients on the coast were very strong, but not extraordinary. The addition of momentum from a strong upper air flow provides a reasonable explanation for the record and near-record gusts observed on parts of the coast. Likely, significant instability was associated with the moist frontal system that brought copious rains to the region, a means to mix momentum from the middle atmosphere. Also, with a SSW direction at many locations, an enhancement of surface wind speeds from windward-side pressure-ridging along the Coast Range, which may have contributed to the development of a low-level "coastal jet," is likely another contributor. The extreme H850 winds during the Great Coastal Gale likely contributed to one other significant storm feature: The deluge. A river of air, full of tropical moisture, crashing into and over mountain ranges at approximately 100 mph--forcing the airmass to rise sharply and suddenly cool--is likely to drop an enormous amount of water. |
||||||||||||||||||||||||||||||
|
Storm-Related Photos Newport, OR, Vicinity |
||
|
|
|
|
|
Lincoln City, OR, Vicinity |
|
|
|
|
|
Tillamook & Bay City, OR, Vicinity |
|
|
|
|
|
|
|
|
|
|
|
Rockaway Beach, OR, Vicinity |
|
|
|
|
Wheeler, Nehalem and Manzanita, OR, Vicinity |
|
|
|
|
|
Hwy 26 & Hwy 101 Junction Eastward to the Necanicum Junction The "Blast Zone" |
|
|
|
|
|
|
|
Seaside and Gearhart, OR, Vicinity |
|
|
|
|
|
|
Astoria, OR, Vicinity |
|
|
|
|
|
|
|
|
|
Ilwaco and Long Beach, WA, Vicinity |
|
|
|
|
|
|
Nemah, Bay Center, Raymond and Aberdeen, WA, Vicinity |
|
|
|
|
|
|
|
|
|
|
|
|
Last Modified: November 23, 2008 | Back | |