Wettest Month in State History – December 1933
February 6, 2018
In three previous newsletters we’ve reviewed the warmest (July 1985), coldest (January 1950), and driest (July 1960) months over the last 100 years for WA State. Here we complete the series with a look back at the wettest month in WA State history dating back to when modern records began in the 1890s: December 1933.

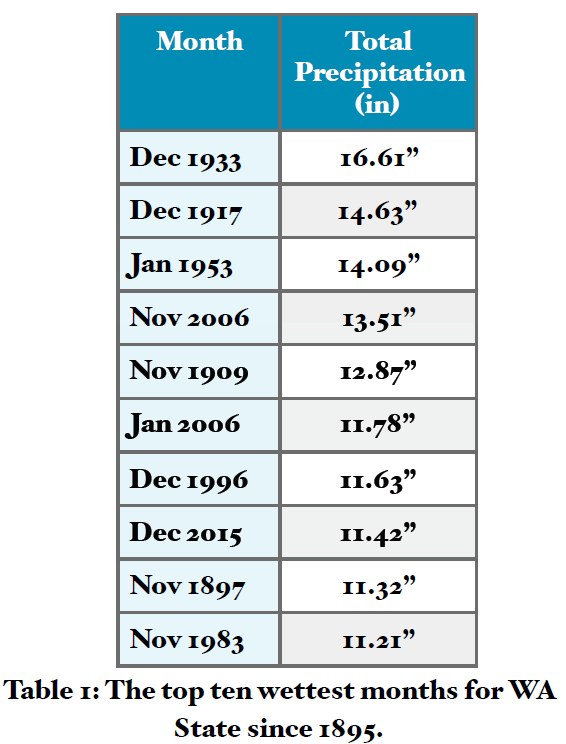
Averaged over WA State, total precipitation for December 1933 was 10.48” above the 1981-2010 normal with a total of 16.61”. The top ten wettest months for WA are listed in Table 1. December 1933 recorded nearly 2” more than the 2nd wettest month on the list (Dec 1917) and nearly 3” more than the wettest month in the last two decades (Nov 2006). Since we’re comparing precipitation averaged over the state, it is interesting to examine the variability throughout different regions of the state. Figure 1 shows the Dec 1933 precipitation anomalies for the 10 climate divisions in WA. An incredible amount of precipitation pounded down on western WA. The West Olympic Coastal climate division received 37.87” of precipitation, a whopping 22.20” above the 1981-2010 normal. The climate division making up the western slopes of the Cascades also had nearly 20” more precipitation than usual. Eastern WA was wetter than normal as well, but the anomalies were not nearly as large. The Central Basin climate division, for example, received 2.97” for the month, on average, which is 1.32” above normal.

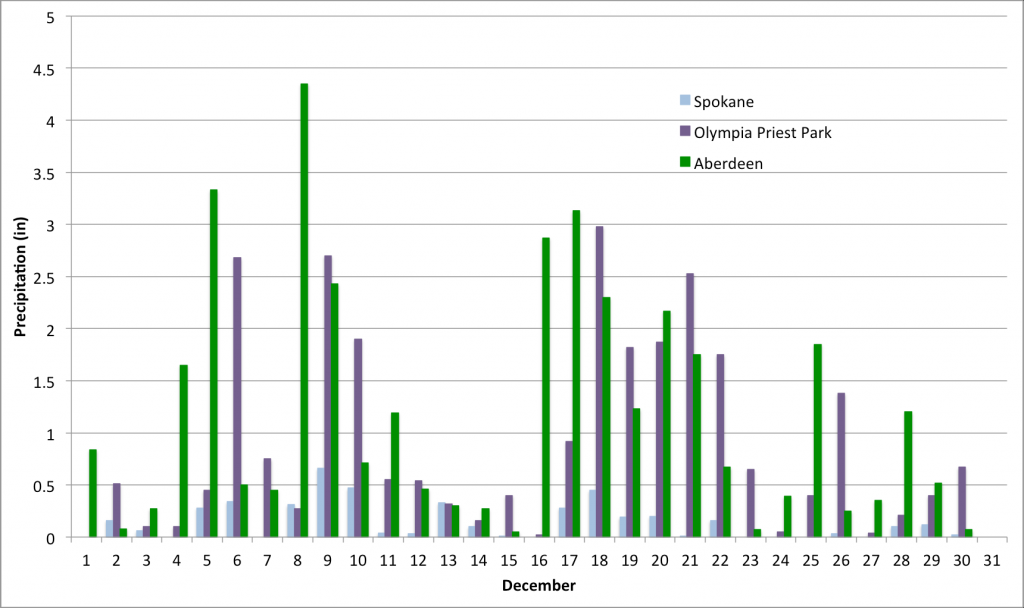
Examining the daily precipitation records for several stations shows that the month was characterized by both heavy and frequent rain. Figure 2 shows the daily precipitation for Spokane Airport, Olympia Priest Park, and Aberdeen stations during December 1933. In addition to a handful of 2”+ days on the coast and in the Puget Sound, it rained practically every day of the month. There was only 1 day without measurable precipitation on the coast, while Olympia and Spokane only saw 2 and 9 days, respectively, without measurable precipitation.

Using 20th Century Reanalysis data, we are able to construct a map of the 500-hPa geopotential height anomalies during Dec 1933 to get an idea of the regional circulation (Figure 3). A southwest to northeast trough of lower than normal heights extended from offshore of British Columbia into western Canada, resulting in anomalous southwesterly flow aloft over WA State. This is a classic pattern for wet conditions. Both the statewide average temperatures for the month (+5.7°F above normal) and the station temperature data indicate that the month was warmer than usual. While there were a few days with snow recorded at Spokane Airport, it was generally a mild month with higher snow levels and a lot of rain. Warmer than normal temperatures accompanying very wet months in WA is typical, but not the rule. Of the top ten wettest months itemized in Table 1, there were seven with above normal temperatures. This was especially the case for January 1953, which checked in with the warmest mean temperature for the month in the historical record with an anomaly of +5.5°F.

Looking at the bigger picture, the winter of 1933-34 appears to have been in the moderate La Niña category. According to HadlSST1, the NINO3.4 index was -1.21°C but the other variables such as winds are likely to have been somewhat less anomalous. WA State does tend to see more precipitation during La Niña winters, so this does not come as a big surprise. It is worth noting, however, that tropical Pacific observations are not as complete and as reliable prior to about 1950, and so there is some uncertainty in the state of ENSO during late 1933. Six of the top ten wettest months appear to have occurred during La Niña events (of variable intensity) and the others occurred during both neutral and El Niño conditions. In other words, we should not expect a strong correspondence between ENSO and extreme precipitation on a monthly time scale in WA.
In summary, averaged across the state, December 1933 ranks as the wettest month since records began in the 1890s. While the entire state was wetter than average, the anomalies were much larger for locations west of the Cascade crest. The month was characterized by both heavy and frequent rain, but also had above normal temperatures. There are several historical accounts of severe flooding during the month as well, from the Yakima River, to the Cedar River, to the coast, and in between.
