July 1985: Warmest Month on Record for WA State
July, 2015
This month represents the 30th anniversary of the hottest month on record for WA state – July 1985 – in the last 100 years. In recognition of the relatively warm temperatures that have prevailed in this neck of the woods during the last couple of years or so as well as the record warm June 2015 temperatures, it seems appropriate to review the weather of July 1985.
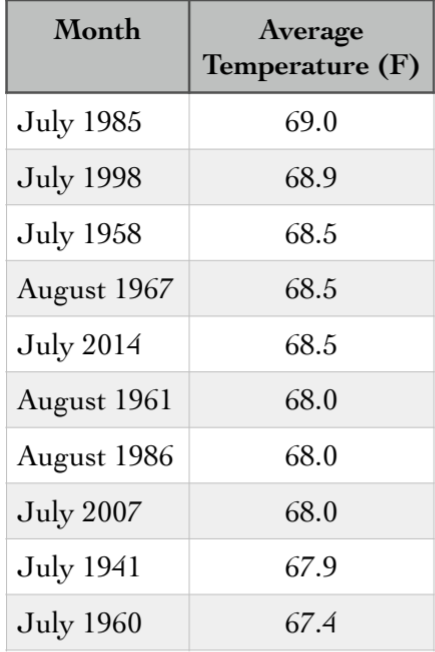
The average statewide temperature during July 1985 was 69.0°F, which represents an anomaly of 4.9°F relative to a base period of 1901-2000. This temperature was not really an outlier; there have been other months almost as hot statewide, as indicated in a list of the ten warmest months (Table 1). The majority of these 10 months have been in July. Pacific Northwest heat waves occur most often in July (Bumbaco et al. 2013), and the longer nights of August generally (but by no means always) result in lower minimum temperatures, especially in eastern Washington.
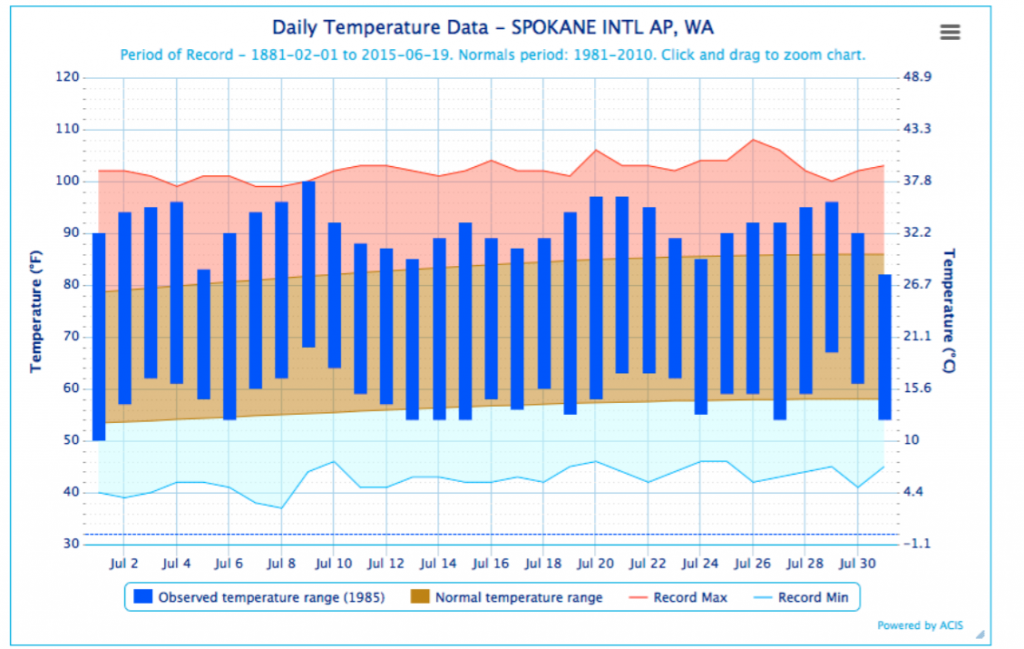
The daily maximum and minimum temperatures for July 1985 at SeaTac Airport (SEA) and Spokane International Airport (GEG) are shown in Figures 1 and 2, respectively. The month of July 1985 actually lacked much in the way of extreme heat. An exception is represented by 9 July at GEG, for which the 100°F maximum temperature tied the record for the day. Instead, the month featured 4 multiday periods of relatively high maximum temperatures, with only 6 days below normal at SEA and 2 days below normal at GEG. Minimum temperatures tended to be higher than usual, but to a lesser extent than the maximum temperatures. This is different from the summer of 2014, which included notably high minimum temperatures in association with relatively high humidity. July 1985 was also quite dry; the statewide average precipitation was 0.20” compared to the normal (1901-2000) value of 0.90”. In other terms, it was tied for the 9th driest July of the 20th century.
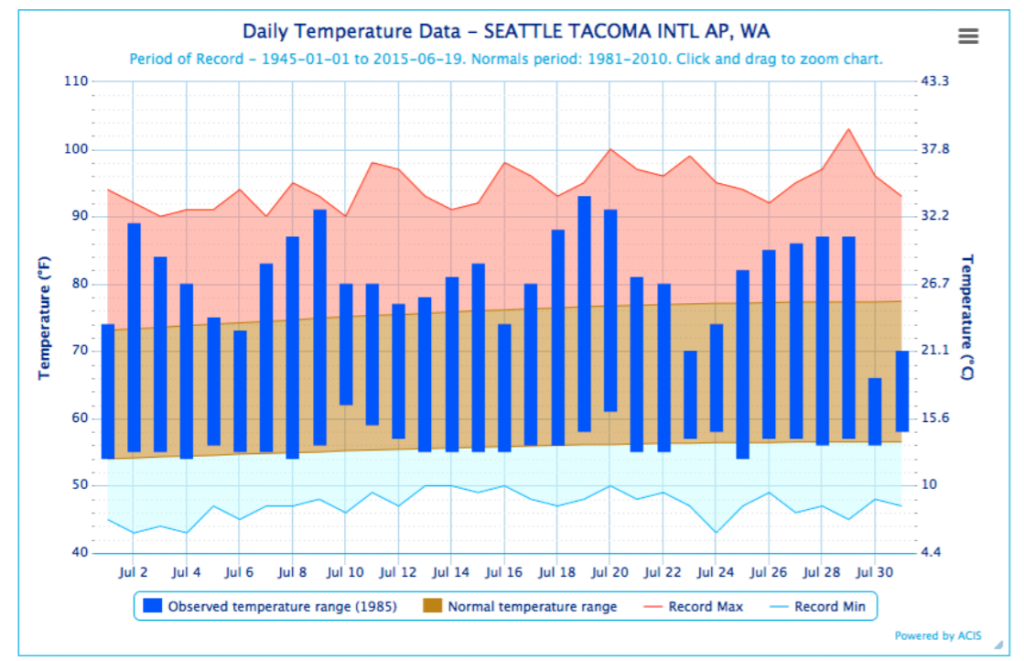
the daily record minimum temperatures.
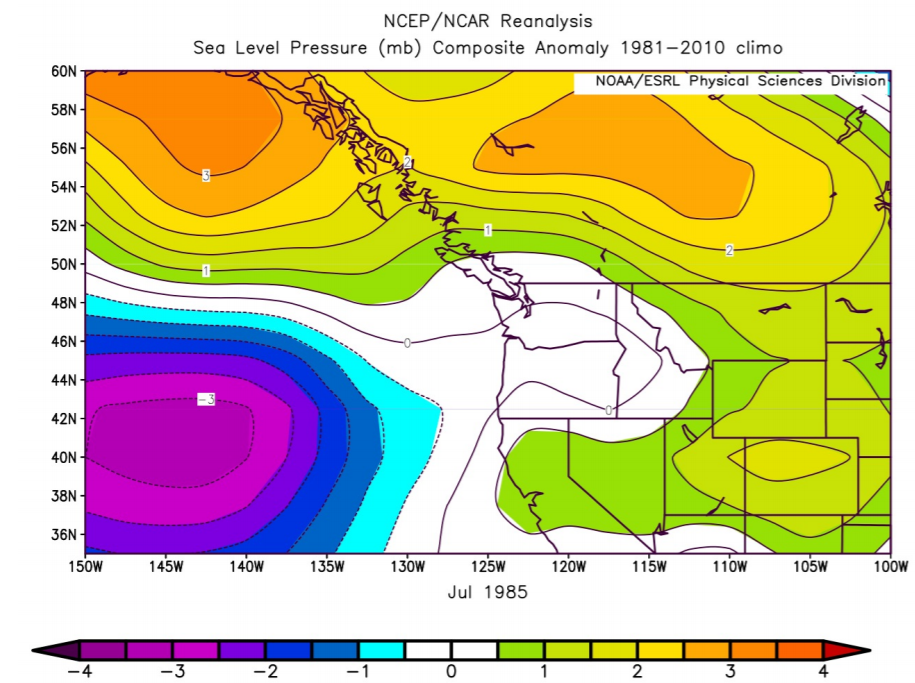
What caused it to be so toasty in July 1985? As we are inclined to do in this corner, the regional atmospheric circulation is summarized in the form of 500 hPa geopotential height (Z) and sea level pressure (SLP) anomaly maps. Not surprisingly, the 500 hPa Z was anomalously high over WA (Fig. 4). The magnitude of this anomaly is substantial for a summer month, but there have been other Julys with higher 500 hPa Z over the state, including just last year. The SLP anomaly pattern (Fig. 5) is mostly similar to that of the 500 hPa Z, with an important difference. Specifically, the SLP was near normal over WA. The minimal SLP anomaly along with above normal heights implies high thicknesses, i.e., positive temperature anomalies in a vertically-averaged sense from the surface to the 500 hPa level. Lower SLP is also the signature of the thermally-induced low-level trough characteristic of hot weather in summertime in the western US (Brewer et al. 2012).
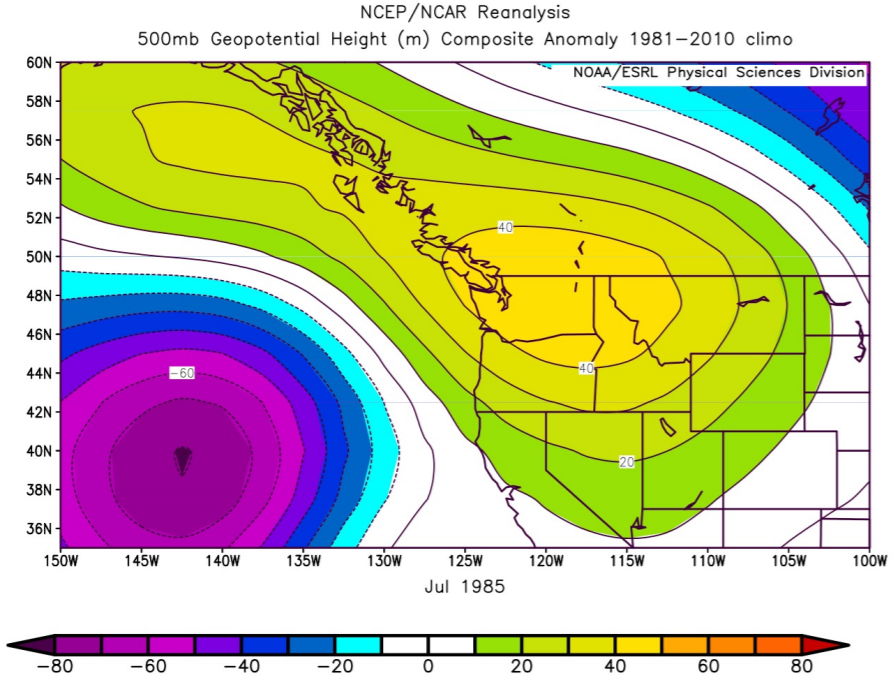
to the 1981-2010 normal.
to the 1981-2010 normal.
Some folks are wondering whether the hot weather at the end of June into early July 2015 portends blistering temperatures for the remainder of summer. The short answer is not really. While the next few months should be on the warm side for WA state in an overall sense, we cannot say just how warm, and much of anything about the prospects for additional heat waves. But then again, if we get some more of this kind of weather, you won’t need us to tell you that it is uncomfortably hot.
