|
A Strong Windstorm on December 10, 1906 compiled by Wolf Read |
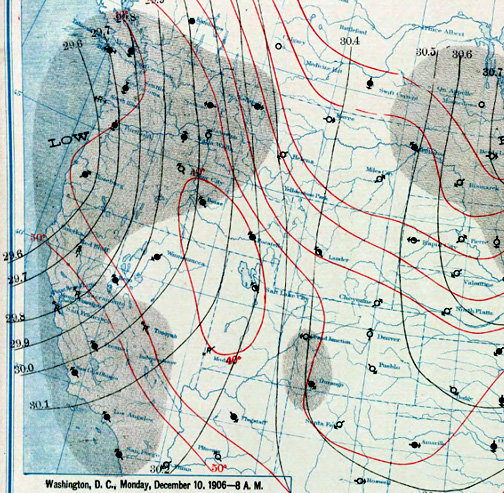
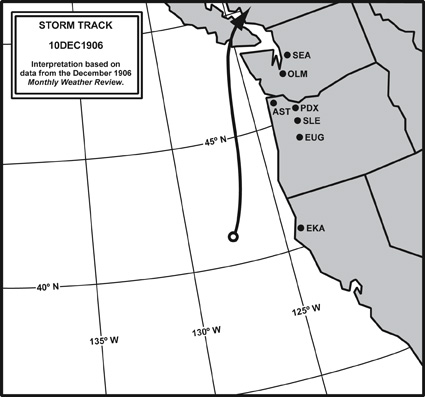
| On December 10, 1906, a deep low raced northward just off the Pacific coast, perhaps along 126ºW longitude, and landing in southern Vancouver Island before turning in a more northeasterly direction. This interpretation is based on a somewhat questionable map of the storm's track in the December 1906 Monthly Weather Review (MWR). A section of the official Weather Bureau surface conditions map appears above, and shows a strong low off of southwest Oregon. Whatever the exact path was, this cyclone lashed the coast with a potent gale that stretched from San Francisco northward into British Columbia, as evidenced by official wind measurements and damage reports, a clear signature of a classic event.
As if the great earthquake of April 18, 1906 wasn't enough, powerful winds tore through the San Francisco Bay Area just eight months later. According to the National Park Service's documentation on the Presidio's history, the windstorm toppled a barracks at Fort Miley, and disrupted slate roofs, windows and fences at the Presidio. |
|
A Forecaster for the Weather Bureau's "San Francisco Forecast District," summarized the windstorm in the December 1906 Monthly Weather Review:
This statement was made by a Forecaster from the "Portland, Oreg., Forecast District," also in the December 1906 MWR:
The following storm track map is at best a rough estimation based on available information from the December 1906 MWR. |
|
|
|
Storm Data Offical wind measurements from the time period of this storm are widely spread and are of a different character than modern records. Data and summary tables of monthly weather data in the December 1906 MWR provide some of the details about this strong windstorm. The data generally point toward a storm path similar to other big sou'westers, as depicted in the above map. Note on wind readings from the pre-1928 time period: Four-cup anemometers made out of brass and weighing 550 grams, with cups four inches in diameter, were employed by the Weather Bureau pre-1928. Due to the unique inertial response of the anemometers, readings from a 4-cup system tended to be high when compared to the actual wind velocity. This physical reality was carefully studied in the late 19th century with the results reported in the MWR. What this means is that the 4-cup readings, as reported in the MWR and other sources, need to be adjusted downwards to be comparable to the 3-cup anemometers that were employed from 1928 to approximately 2006 (from about 2003 to 2007, many official cup anemometers were replaced with sonic anemometers). In general, a 4-cup system reads about 9.0% high when indicating 25 mph, 22.5% high when indicating 50 mph, 27.7% high when reading 75 mph and 30% high when reading 90 mph [3]. Original 4-cup figures are shown in the data below, with corrected readings in parenthesis. Correction factors are based on a table provided in early issues of the MWR, and the table accessed appeared in January 1894, Vol. XXII, No. 1, pp 28-29. Table of Peak Wind and Estimated Gust
* Peak gust is conservatively estimated using a standard 1.3 gust factor; this gust factor is normally applied to 1-minute winds, and is likely higher for 5-minute readings. Note that many of these anemometers were well above the standard 10-meter (~33 feet) height officially employed in the modern ASOS era, which means that the maximum 5-minute winds could be revised downward for a more accurate comparison to recent storms. The readings at both Seattle and San Francisco would be the most strongly effected. |
|
Last Modified: November 29, 2007 | Back | |