Comparative Examination of Windstorms

Class 6 Events

compiled by

Wolf Read

Class 6: Cyclones That Track Northward Off the Pacific Coast Inside 130ºW Longitude

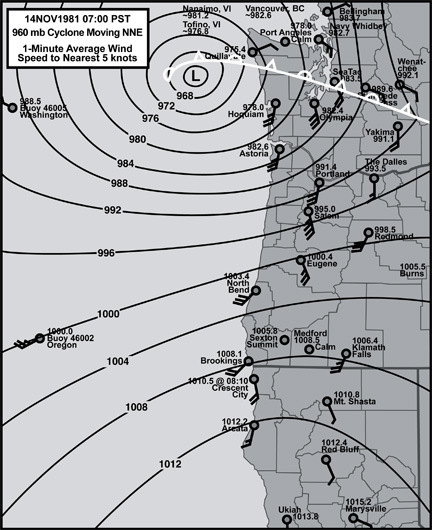
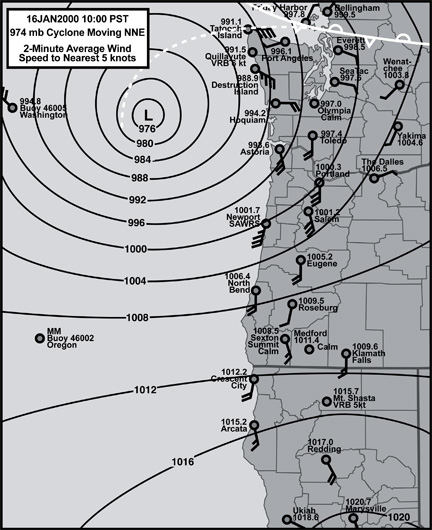
A typical track for Class 6 windstorms is initially east to northeast, with a turn to the north to north-northeast offshore of northwest California (usually inside 130ºW longitude), a path that typically brings the low center onto Vancouver Island without landing in California, Oregon or Washington. This brings a Class 6 cyclone's core close to the Pacific Coast along the entire length of the region-of-interest. As the low progresses northward, all of the area ends up south of the low center, and is subjected to the cyclone's powerful southerly winds. Due to a favorable upper-air flow, more-or-less south, and an overall northward momentum of the storm, strong southerly winds are supported in the south-north trending valleys. Therefore, even without a landfall and subsequent close-passage of the low's center to the north of inland stations (as with Class 1 through 5 events), Class 6 events tend to produce the strongest inland-area winds.

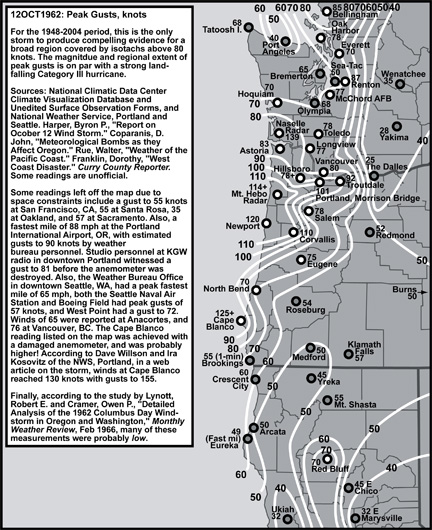
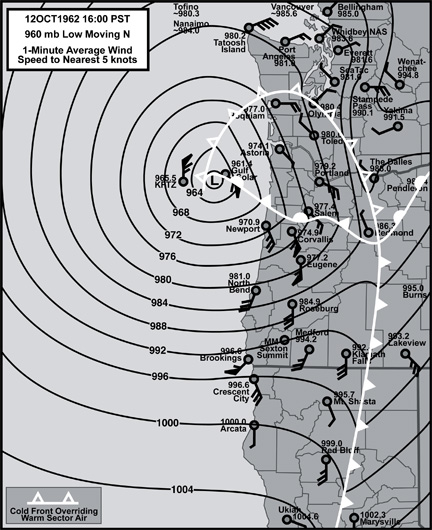
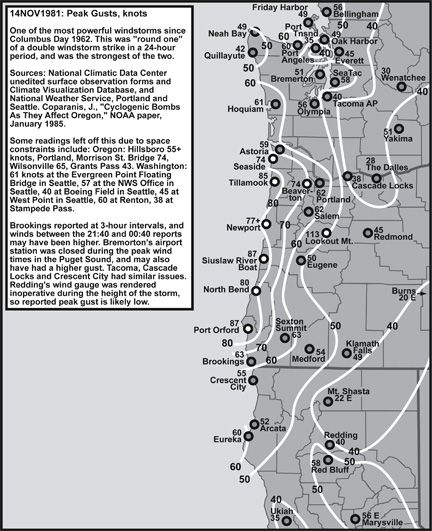
The power of the delivered gale in Class 6 storms appears to be largely related to the strength and timing these five variables: 1) The proximity of the low to the coast: The nearer the low, the stronger the winds. 2) Cyclone depth: The deeper the low, the further from the coast it can be and still generate damaging inland winds. 3) Cyclone track: The closer the path is to due-north, the better the support for strong southerly winds at inland locations. 4) Cyclone speed: The faster the cyclone moves, the stronger the surface winds. 5) Cyclone development: If the timing of peak development happens after the hook northward, making it coincide with the low's close passage to the coast, the stronger the winds. If all these variables come strongly in phase at a similar time, a "perfect storm" results. This is a very rare event. There is only one storm from the 1948-present era where all these conditions were met strongly: the 12 Oct 1962 "Columbus Day Storm". The result was equivalent to a Category II to III hurricane. All other Class 6 events have had considerably less impact than the Columbus Day Storm, and the lesser blows usually can be explained by one or more of the above variables not being met to as significant degree as on 12 Oct 1962.

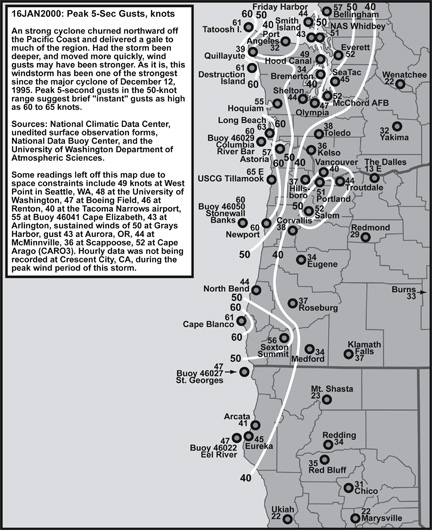
The Oregon Coast and Willamette Valley appear to receive the brunt of these storms, especially when controlling variables are well in phase. Inland, the region from about Salem, OR, north to the vicinity of Vancouver, WA, is typically lashed with the strongest winds. Washington certainly takes a serious pummeling, but wind speeds tend to be relatively lower than those measured in Oregon. It appears that a wind "dead zone", where peak gusts are considerably less than regions both south and north, is a typical response over parts of the Puget Lowlands. This lower-velocity region may show up in the Seattle-Tacoma region. Note that this is relative: Wind gusts can still reach high-wind criteria, but they may be 20-knots-or-more slower than surrounding areas.

26 Oct 1950

26 Oct 1950: This storm is a marginal Class 6 event, mainly due to it having more of a northeast track than northerly--the low didn't take on a nearly straight north path until it was offshore of Washington. However, given an origination fairly far to the south, the low's depth, and its generally northerly path off of Washington, the event created a pattern of peak gusts that fits within the classification. The strong east-west elongation of the low likely contributed to the strength of the winds, as it resulted in a situation where the isobars were well-aligned for ageostrophic "jumping-the-gradient" airflow on the coast and inland. Despite this cyclone's track far offshore to the west, some noteworthy minimum pressures occurred at coastal and inlands stations (also due to the east-west elongation): Quillayute had a 971.5 mb minimum, Astoria 974.6 mb and Bellingham 976.0 mb. Variables that worked against this storm from having even stronger winds: Far offshore track, more of a NE movement than N, and the system matured while still far offshore of OR. Interestingly, this low followed a "U" path, developing at about the latitude of Astoria near 145ºW and diving southeast to about 42ºN and 137ºW, before swinging back on a more northerly track. Most Class 6 events develop far to the south and spend their entire time on a track with a northerly vector.  

12 Oct 1962

12 Oct 1962: A storm to remember. This cyclone met the abovementioned five variables very strongly: A deep 960 mb low tracked nearly due north at an incredibly fast pace, nearly 45-knots off the Oregon coast, reached peak intensity as it neared Astoria, OR, and the center tracked very near the coast, about fifty miles offshore. The result: Wind gusts in excess of 100 knots in the Willamette Valley, 120 knots on the Oregon Coast, the largest loss of life out of any windstorm on record (if some maritime-specific disasters are ignored), and the largest blowdown of timber in Northwest history. Total damage in 1962 dollars exceeded $270 million. A repeat of this event today could result in a $10 billion disaster and a disruption of the electrical grid that could leave some locations in the dark for months. After reaching peak intensity off of Astoria, the low began to degrade, and this may by the primary reason why Washington did not quite receive the same level of winds seen in Oregon. For Oregon, this is a worst-case scenario. Pressure tendencies for this storm, which were very strong throughout the region, were incredible, with an average maximum declension (of 11 key stations in CA, OR and WA) of -4.6 mb/hr and the average maximum rise of +6.2 mb/hr. Many stations, even inland ones like Salem, showed peak pressure tendencies that are on par with intense landfalling cyclones (-5.5 mb/hr and +7.6 mb/hr for Salem). Note that landfalling cyclones are favored for very fast pressure changes due to the low's passing in very close proximity to some stations--the Columbus Day Storm produced extreme pressure changes despite passing nearly a hundred miles to the west of inland valley stations! The intensity and speed of the low is reflected in these sharp barometric tendencies.

14 Nov 1981

14 Nov 1981: Out of all the windstorm events since 12 Oct 1962, the 14 Nov 1981 cyclone came the closest to repeating the legendary "Big Blow" of 1962. Peak development of both storms occurred off the Oregon coast, and both had similar minimum pressures (around 958 to 960 mb). Key differences that worked against the 1981 storm having as strong an impact on land as the 1962 event were: 1) The low tracked further offshore by approximately two to three degrees longitude, reaching 128ºW at the latitude of Astoria as compared to 125.5ºW for the 1962 storm. 2) The 1981 cyclone traveled northward at a slower pace, moving at 30 to 35 knots, which was about 10 knots slower than the Columbus Day Storm. The result: Peak wind gusts were about 30 to 40 knots slower among inland regions (with some notable exceptions: Sea-Tac Airport had a markedly higher gust in 1981), and generally 10 to 20 knots slower on the coast (with some notable exceptions: North Bend had a higher gust in 1981). Nevertheless, the Columbus Day Storm had such high wind speeds that, even with such a pronounced difference in maximum gusts, the cyclone of 14 Nov 1981 still represented one of the strongest windstorms on record. Due to the 14 Nov 1981 cyclone's more westward track, and its slower forward progress, pressure tendencies were much more tame than in 1962 (relatively speaking), with 11-station-average peak-changes at -3.7 mb/hr and +3.8 mb/hr.

16 Jan 2000

16 Jan 2000: The strongest classic event of modern (ASOS) times. This cyclone delivered a fairly widespread blow in the interior that nearly matched the 14 Nov 1981 storm in peak wind speeds (especially when the peak 5-second gusts recorded in 2000 are adjusted to reflect the peak instant gusts recorded in 1981) in many regions. Much of the coast, however, had considerably slower winds than even the 1981 storm. Variables that worked against this cyclone from delivering a stronger gale on land: 1) With a minimum central pressure around 974 mb, this storm was not as deep as the 1981 and 1962 events (both were around 958-960 mb). 2) The low tracked further west than the 1962 storm and somewhat closer than the 1981 storm, reaching about 127ºW at the latitude of Astoria. 3) The low moved more slowly than both the 1962 and 1981 events. 4) The low tracked a bit more northeasterly than the 1962 and 1981 storms. Peak 11-station-average pressure-tendencies for the 16 Jan 2000 windstorm, which showed average maximum declensions of -2.7 mb/hr and average maximum rises of +2.9 mb/hr, values considerably lower than what was recorded for the 1962 and 1981 events, reflect the differences in the key variables.

Notes

Other notable Class 4 events include 21 Dec 1940, 04 Dec 1945, 14 Apr 1957 and 11 Oct 1962.

Last Modified: September 24, 2007
Page Created: September 24, 2007

You can reach Wolf via e-mail by clicking here.

| Back |