Steep Decline in Streamflows in WA State
July, 2018
The total statewide averaged precipitation for the 2018 water year to date (1 Oct through 30 June) has been about 3.6” above normal. There was a healthy snowpack on 1 April — the traditional end of winter from the snowpack perspective — with snow water equivalent (SWE) values ranging from about 136% of normal in the Upper Columbia region to 98% in the southern Puget Sound region. The snowpack situation continued to improve relative to climatological norms through the middle of April due to abundant precipitation across the whole state. It might therefore be expected that streamflows in WA should be in fine shape as the warmer and drier weather of summer approaches. But that is not necessarily the case.

It is a different story for different parts of the state, as illustrated in a map of the 7-day average streamflows on rivers in WA state on 1 July (Figure 1). The discharges are mostly in the normal range (25 to 75% percentile class) in the northeast part of the state. On the other hand, elsewhere quite a few streams are running below normal, and a fair number are in the much below normal category, especially in southwestern WA. How did this situation arise?

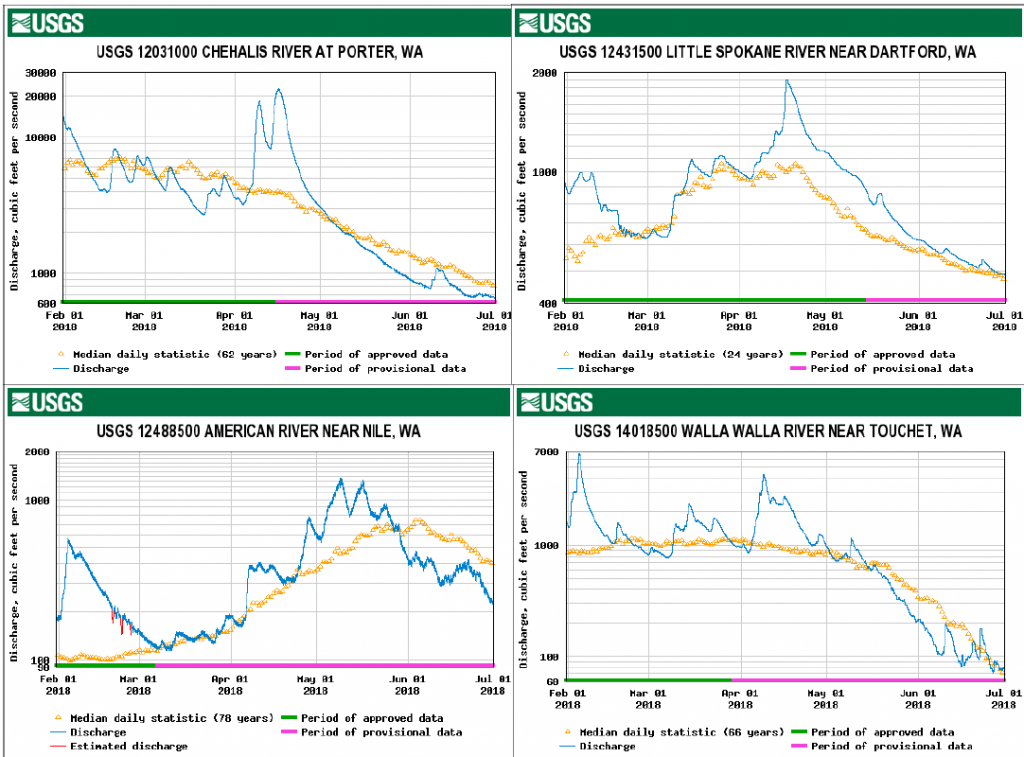
We can blame the aforementioned warm and dry weather in May followed by a dry June. The warmth in May resulted in rapid snowmelt in the higher elevation basins. The concerns then were too much rather than too little water, with major flooding in Ferry, Okanogan and Pend Oreille counties. The lack of rainfall in May that lingered into June meant little new supply for the rain-fed streams at lower elevations, especially on the west side of the Cascades. The rapid change in conditions can be seen in the time series of daily streamflow from 1 February through 30 June on 4 rivers in WA that are shown in Figure 2. A particularly steep decrease has been observed on the Chehalis River near Porter; it is interesting that April mean value of 8641 cfs during 2018 was the 2nd highest in the record back to 1953 while the mean of 800 cfs for June is in the lowest 25 percentile. The Little Spokane River is holding up better, at least in part because the SWE was so much greater than normal in northeastern WA. The Walla Walla River in the southeast generally has low flows by early summer. Note that the current year features a relatively early onset of these low flows, with presumably ecological impacts as well as water supplies. A similar shift in timing is also shown in the hydrograph for the American River, which experienced its peak spring flow about 2-3 weeks early.


The streamflows across the state have certainly gotten the attention of the Water Supply Advisory Committee (WSAC) for WA state headed by the Department of Ecology. While current conditions are not nearly as severe as those in early summer of 2015 following the dearth of snow in the winter of 2014-15, there are concerns for various pockets of the state. There are also similarities to the 2016 water year, when really warm April temperatures caused our normal to above normal snowpack to melt early and fast. The SWE trace for the Touchet Snotel site (Walla Walla basin) in Figure 3 shows these marked drop offs in both water years. It is starting to look like this will be one of those years in which we will be eagerly awaiting rather than dreading the return of the wet weather of fall.
