Winter Air Pollution in Washington State
November, 2016
Here we revisit a topic discussed in a previous edition of this newsletter (January 2011), and that is particulate pollution during the winter in Washington state. There is some good news, but it remains a public health hazard at times in many parts of the state. A recent online publication from the American Lung Association includes a “Report Card” for Washington state. By one measure, based on data from 2012 through 2014, every county of the 9 in the state with sufficient data received a “Passing” grade with respect to particulate pollution. From a different perspective the grades for individual counties ranged from A to F! What accounts for the discrepancy?
First the bad news, and the less than stellar grades for some counties. Periods of high particulate pollution occur every winter in WA. They are almost always associated with calm weather and cold nights accompanying high sea level pressure. Commonly there is also reduced cloudiness or even clear skies, which means reduced downward longwave radiative heat fluxes and hence more nighttime cooling. The cold air that forms at the surface tends to persist because of the lack of much wind; the high static stability of the lower atmosphere traps pollution in a shallow layer. The pollution itself is small particulates that in large part is made up of wood smoke from residential sources. Concentrations of particulates less than 2.5 microns in size (PM2.5) between 35.5 and 55.5 micrograms/m3 are in the category of “Unhealthful to Sensitive Groups”. The “Unhealthful” category is for PM2.5 in the range of 55.5 to 150 micrograms/m3. Of the 9 counties that can be given grades, Pierce and Yakima had enough days with elevated values of PM2.5 to receive grades of F. On the other hand, Kitsap and Whatcom did not have any days above the threshold and were assigned grades of A. But while that is the kind of report card you liked to show to your parents, those counties do not necessarily deserve much credit, nor do those with poor marks deserve scorn. The propensity for local weather conditions favoring the build-up of PM2.5 varies widely across WA, in large part due to the terrain, and has an impact on which locations exceed the thresholds.
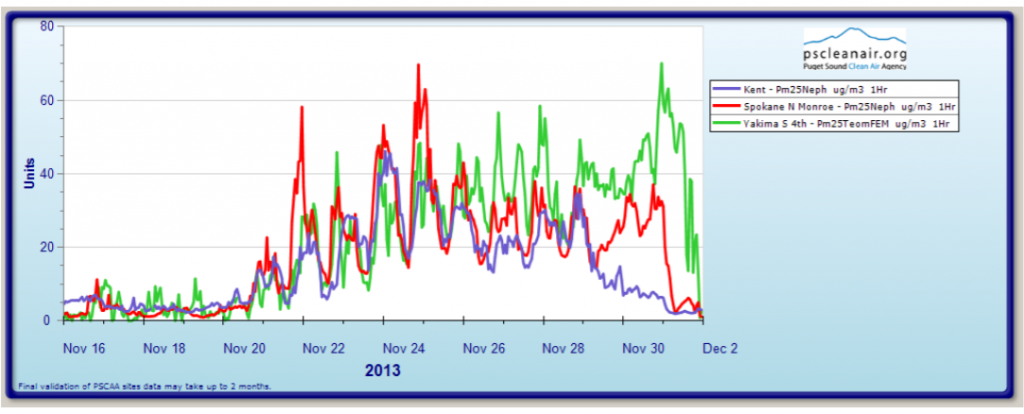
An example of the concentrations of small particulates (PM2.5) that occur during a wintertime air pollution event is illustrated below. Specifically, Figure 1 shows hourly PM2.5 concentrations from 15 November through 1 December 2013 at monitoring sites in Kent, Yakima, and Spokane. Each site experienced PM2.5 concentrations in the range of the “Unhealthful to Sensitive Groups” category for a number of hours. Both Yakima and Spokane were in the “Unhealthful” range on multiple days. While there are differences between the time series at these three sites, we were struck by the commonalities for this event, and for that matter, other events that have been examined. The timing of the onset of the episode, and the nature of the ramp-up in PM2.5 concentrations, appears to have been similar from Puget Sound to the far eastern part of WA. In addition, the diurnal cycles are comparable, with nighttime maxima in PM2.5 concentrations typically about twice as high as the late afternoon minima. On the other hand, the event lasted a few days longer at Yakima and Spokane due to longer persistence of settled weather on the east side of the Cascade Mountain crest. This was particularly the case at Yakima, where the peak PM2.5 concentrations occurred on the night of 30 November, in which the average wind speed was only 0.8 mph at Yakima Airport that day.
We did a bit of exploring into the relationships between wind speeds and PM2.5 concentrations in the winter months using data from the Kent site. The linear correlation coefficient between these two variables in terms of daily averages was about -0.6. For the period of the November 2013 event shown above, hourly values of wind speed and PM2.5 concentrations have a correlation coefficient of about -0.7. The winds are not the whole story, of course, but in general, fall and winter days with low speeds tend to be the ones with crummy air.
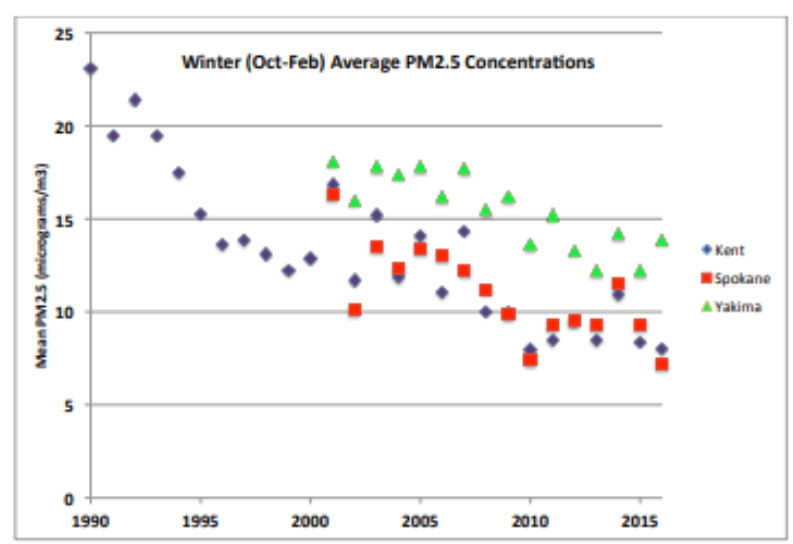
We are pleased to report some good news, and that is that all monitoring locations in WA state during the period of 2012 through 2014 had annual average PM2.5 concentrations that met the EPA’s national air quality standard. This is the reason for the aforementioned “Passing” grade for all the counties of WA with enough data. Moreover, PM2.5 concentrations exhibit a long-term decline, as shown in terms of winter averages (October through February) for Kent, Spokane and Yakima (Fig. 2). The drop in average concentrations at Kent was especially pronounced from 1990 to 2000; we were unable to easily acquire data prior to 2000 for Spokane and Yakima. The improvements in air quality, in spite of increasing populations, can be attributed to the phasing out of older and often dirtier wood stoves, and better communication and compliance with burn bans. Perhaps some of the improvement is due to increased temperatures and therefore folks simply not burning up as much wood.
While overall air quality in winter has improved in WA, it does vary from year to year. As shown in Figure 2, PM2.5 concentrations were higher in the winter of 2013-14 than in 2015-16, for example. Again just considering the winds, and using the arbitrary threshold of an average speed of less than 4 mph as the definition of a low wind speed day, the two winters were compared. The result was 40, 42 and 85 low speed days during the winter of 2013-14 at SeaTac Airport (KSEA), Spokane Airport (KGEG) and Yakima Airport (KYKM), respectively; 23, 27 and 56 low speed days occurred during the winter of 2015-16 for the same locations. Yakima is almost surrounded by higher terrain and the low wind speeds that result likely contribute to its relatively poor air quality. Will the upcoming winter be more like 2013-14 or 2015-16? We will let you know how it plays out.