Melting of the Cascade Snowpack in Spring
The date of 1 April is often considered the end of winter for the Cascade Mountains of the Pacific Northwest. Snow can continue to fall in the high country, of course, but the vast majority of the accumulation has generally occurred by that time of year. This means that the main issue involving our precious snowpack now is not so much how much there will be but rather how long will it last. Sometimes it hangs around well into summer and other times it melts and runs off quickly. And the latter implies not just less water in the snowpack “reservoir” for summer, but can lead to significant flooding, as for the Okanogan River in north central WA in 2018. With that in mind, we have examined recent trends in the melting, arbitrarily defined as the difference in the snow water equivalent (SWE) on 1 June versus 1 April, and how closely mean weather conditions relate to the changes in snowpack over that two-month period. We assume SWE values are important on 1 June because that is when irrigation demands go up, and freshwater ecosystems can start to become adversely impacted by low streamflows. The present analysis uses SWE data on the first day of the month from 5 sites along the spine of the Cascades (Harts Pass at 6490’, Stevens Pass at 3950’, Stampede Pass at 3850’, White Pass at 4440’ and Lone Pine at 3930’). Data are available for all 5 of these stations for the years of 1983 through 2018 from the Natural Resources Conservation Service (NRCS). The weather data considered are the monthly mean values of temperature and precipitation for April and May from the Cascades Mountains West (#5) and East Slope Cascades (#6) climate divisions of WA. As an aside, it turns out the average of these two temperatures is closely related to the corresponding 850 hPa temperatures from the NCEP Reanalysis (linear correlation coefficient ~.97).
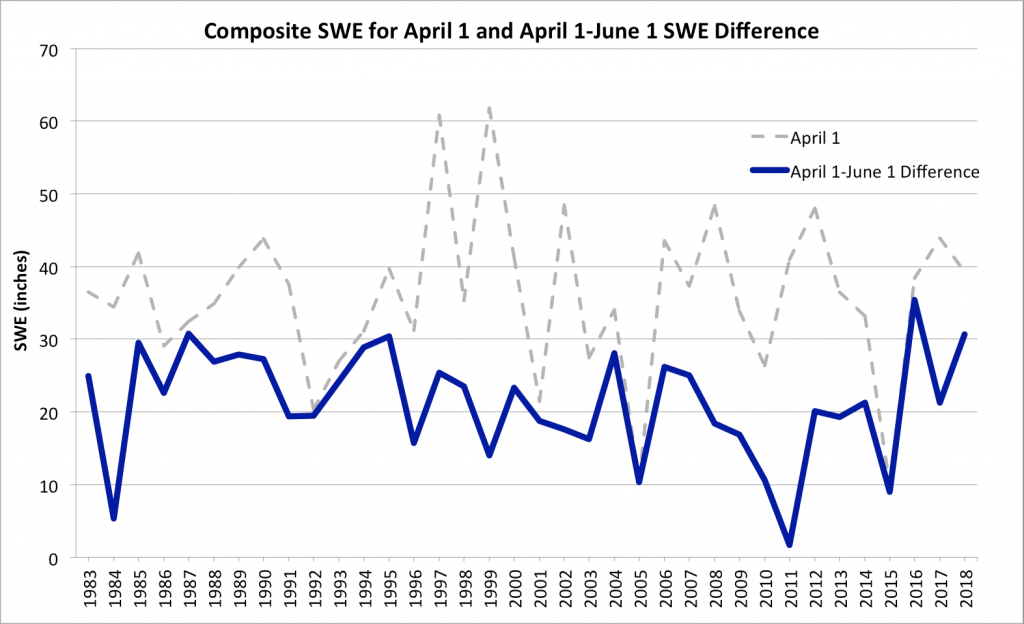
inches on 1 April (gray, dashed line), and change in SWE from 1 April
to 1 June (blue) for 1983-2018.
Time series of the composite April 1 SWE, and the composite decrease in SWE from 1 April to 1 June, are plotted in Figure 1. Both time series feature prominent year-to-year variations and little in the way of systematic trends. The latter result is no big surprise since a 36-year record is on the short side for identifying climate trends. If there is not much snow to begin with obviously there is not that much to melt (such as in 2005 and 2015), but there are years with lots of snow on 1 April without much of a melt/decrease during the following two months (notably 1984 and 2011).
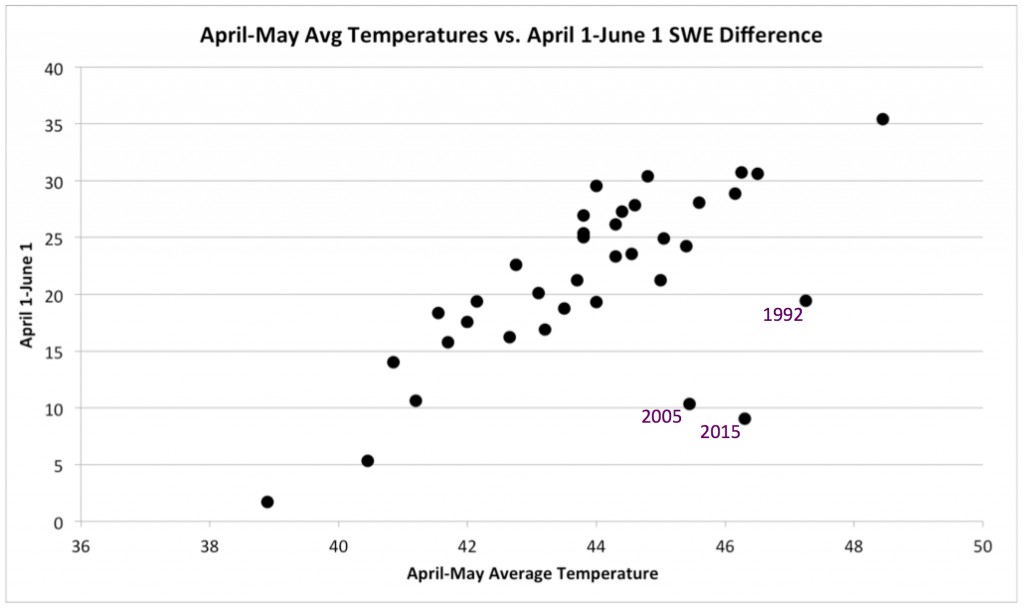
We expect that snowmelt will be positively related to temperature but just how strong is this relationship? The linear correlation coefficient between the composite 1 April to 1 June decrease in SWE with the climate divisions’ temperature for April and May is about 0.67; a scatter plot between the two variables is shown in Figure 2. A fairly tight linear relationship is found with the exception of the outliers represented by the years of 1992, 2005 and 2015. The temperatures these years were evidently warm enough to melt more snow, but there simply was not that much to begin with on 1 April. With those three years removed, the linear correlation coefficient between the decrease in SWE and temperature increases to about 0.9, indicating quite an impressive relationship.
There remains some variability in SWE decrease not strictly related to temperature and we were curious about how precipitation in spring relates to changes in snowpack. The sense of the linkage is not obvious because conceivably more precipitation could serve to melt more snow or conversely, more precipitation could result in more snowfall, especially in April, which would counter the melting. Considering the two months of April and May as a whole, the overall result was that there was a tendency for less of a decrease in SWE during years of greater precipitation (r~-0.4). In other words, precipitation in spring may tend to enhance the snowpack rather than melt it. This is plausible in that the “ripe” snowpacks of early spring generally include channels that allow liquid water entering the top of the snowpack to drain out without much melting. Finally, it bears noting that temperature and precipitation are not independent variables – conceivably the negative correlation found here is simply due to the negative correspondence between temperature and precipitation. It is possible to use multivariate statistical models to investigate the interdependency of these kinds of linkages, but such an analysis is beyond the scope of the present effort.
Det vanligaste sättet och ett av de säkraste är att ta impotenspiller som Cialis bästapiller.se/cialis/. Prata med henne om det och få henne att förstå att det är en tillfällig sak, att med hennes hjälp och stöd kan det vara historia redan innan hon vet om det.
The results shown here may have some meaningful implications. If on 1 April we knew what the mean temperatures were going to be in the Cascades during the next couple of months (and 850 hPa temperatures are sufficient), it looks like we would also be able to make reliable projections of how much SWE would be left on 1 June, at least for the Cascades as a whole. That is a big if, of course. But it is intriguing that other aspects of the weather in spring (e.g., cloud cover) do not seem to really matter.