Cooler Temperatures from the Smoke of September
October 7th, 2020
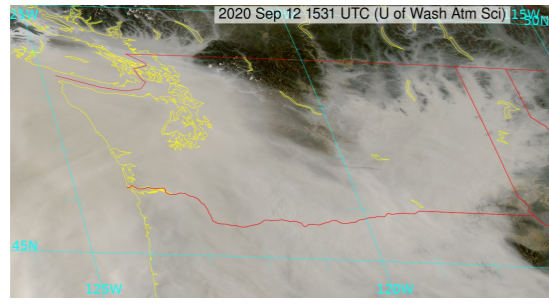
The thick smoke that blanketed much of WA state during a stretch of days in September 2020 is apt to be long remembered. A visible satellite image from the morning of 12 September (Fig. 1) illustrates the grim atmospheric conditions. The event came on the heels of warm and dry weather featuring strong easterly winds – the proximal cause of most of the flare-ups across the region. Here we look into the extent that the cooler temperatures following can be attributed to the smoke.
Our approach has been to compare observed temperatures with estimates of the temperatures if smoke had been absent. The latter are based on model output statistics (MOS) from short-term (24-36 hour) numerical weather prediction model forecasts. In a nutshell, MOS is a type of statistical post-processing that incorporates a combination of prior observations and model predicted variables into the future as input data,
and statistical relationships derived from historical comparisons between model output and actual station observations of temperatures, winds, clouds, etc. MOS forecasts can account for model biases and site-specific effects, and have been shown to be quite skillful (e..g., Baars and Mass 2005). An important point for the present application is that the MOS forecasts we consider here for the most part do not account for the smoke that was present, and hence represent a means for crudely estimating what the temperatures would have been without the smoke. More specifically, we compare the observed maximum and minimum temperatures with their MOS counterparts from NOAA’s Global Forecast System (GFS) model for Seattle (KSEA) and Omak (OMK) in the Okanogan valley of northcentral WA for 5-20 September. We complement these comparisons with time series of the daily values of the air quality index (AQI), and downward shortwave radiation, from nearby stations. The AQI pertains to surface concentrations of PM2.5 and hence low-level smoke, while the insolation relates to vertically integrated absorption and scattering of the sunlight and hence the impacts of the smoke aloft, and clouds, of course.
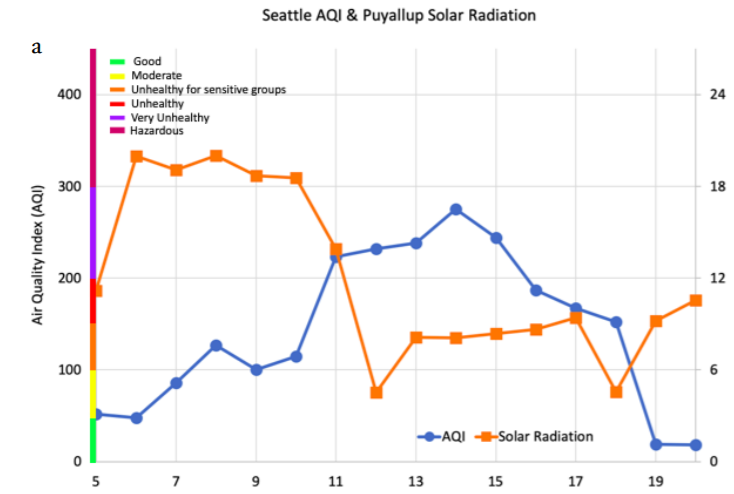
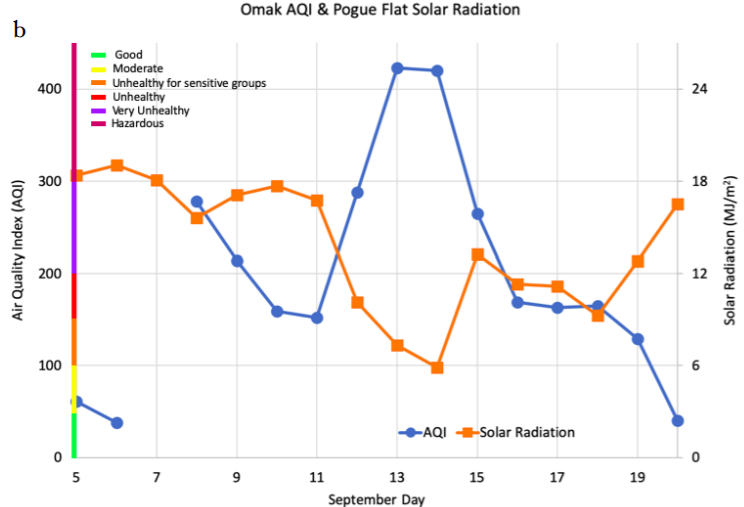
We begin with time series of daily AQI and solar radiation for Seattle (Fig. 2a) and Omak (Fig. 2b). Seattle had an AQI exceeding 200 (“very unhealthy”) from 11-15 Sept, followed by continuous improvement with clean air by the 19th; OMK was quite smoky on the 8th, had a few days of somewhat better air quality and then again really foul air (“hazardous”) from the 12th through 15th with peak particulate concentrations on the 13th and 14th. The solar radiation was inversely related to the AQI at the two locations, but not strictly so, especially in Seattle. For example, the first real smoky days in Seattle (11 September) and Omak (8 September) included only modest declines in solar radiation. The gloomiest days in Seattle (12 and 18 September) were not the smokiest ones. In Seattle, clouds certainly played a varying role in limiting the solar radiation, particularly on the 18th through the 20th as some welcome wet weather moved in.
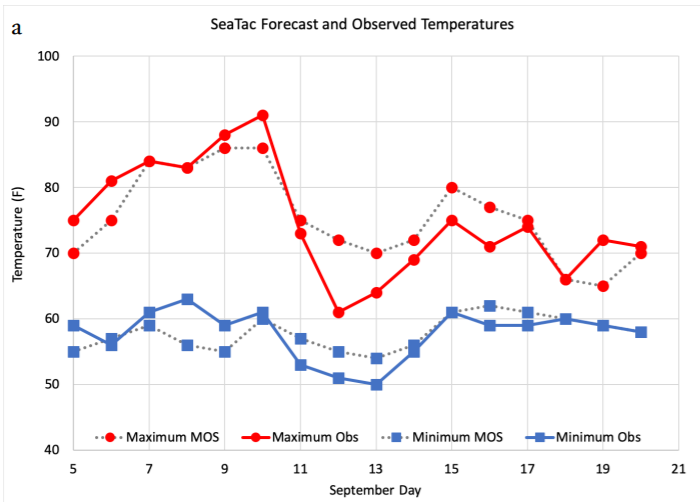
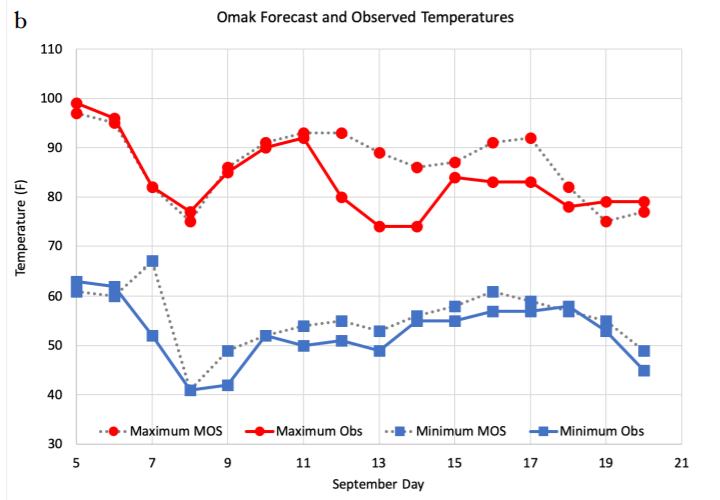
For the first 7 days of the interval considered here, the observed maximum temperatures ran a bit warmer than MOS in Seattle (Fig. 3a) and close to equal to MOS in Omak (Fig. 3b). But it was a different story for the next 5-6 days, with observed maximum temperatures systematically colder than the 24-hour MOS forecasts. The peak differentials were 11ºF at Seattle on 12 September and 15ºF at Omak on 13 September. On the 13th there was even a greater differential for Spokane (GEG), which reached only 67ºF on a day which MOS had 87ºF. It is interesting that the smoky days of 11 September in Seattle and 8 September in Omak lacked much in the way of discrepancies between the observed and MOS maximum temperatures. Conceivably that could be explained by the smoke being mostly just near the ground, and hence while causing poor air quality having a lesser impact on the insolation. That premise is consistent with short-term forecasts from NOAA’s High Resolution Rapid Refresh model with smoke (HRRR-Smoke), which indicated considerably greater smoke concentrations at the surface than aloft for Seattle on the 11th and Omak on the 8th (not shown). In addition, arguably there was a significant impact of the smoke in Seattle on the 11th in that MOS had been consistently underpredicting maximum temperatures, and finally got it about right thanks to the smoke. We note that the observed minimum temperatures were also lower than the 36-hour MOS forecasts during the smoky period in Seattle, as opposed to during the cleaner air from the 5th through the 9th, when they tended to be higher. More or less the same sort of effect seems to have occurred in Omak, recognizing that it had decent air quality only near the start, and at the very end, of the interval considered here. This is an interesting result in that one might suppose that a layer of thick smoke would act like a cloud deck in terms of increasing the downward longwave radiation, and ultimately suppressing near-surface cooling at night. But it turns out that because smoke is largely composed of small particles, it has minimal impacts on the longwave radiation (e.g., Sokolik et al. 2019). It appears that it was relatively cold at night largely because the previous days were chilly.
We recognize that this piece belabors the obvious that blocking sunlight results in cooler temperatures but at the same time we thought that the readers of this newsletter would be interested in the magnitude of the effect. The situation was complicated by the interactions between smoke and clouds. It was relatively cold in Seattle on 12 September not just from smoke – concentrations were higher the next 3 days – but also because the cool temperatures allowed low water clouds and fog to hang around all day. Moreover, smoke concentrations near the surface do not necessarily correspond with those aloft. We are all glad that the abysmal air quality is behind us, and close with the saving grace that at least the cooler temperatures associated with the smoke helped knock down the vigor of the fires that were raging.
References
Baars, J. A., and C. F. Mass (2005): Performance of National Weather Service forecasts compared to operational, consensus, and weighted model output statistics. Wea. Forecast., 20(6): 1034-1047. doi:10.1175/WAF896.1
Sokolik, I. N., A.J. Soja, P.J. DeMott, and D. Winker (2019): Progress and challenges in quantifying wildfire smoke emissions, their properties,
transport, and atmospheric impacts. J. Geophys. Res., 124, 13,005–13,025. https://doi.org/10.1029/2018JD029878