A Review of Winter 2018-2019
5/13/2019
Seasonal weather forecasts from the Climate Prediction Center made in fall 2018 for the winter of 2018-19 were generally indicating warm and dry conditions, in line with the expected El Niño development. Did that actually occur in WA State? Here we review the winter of 2018-19, defined as the 6 months from October through March.
Figure 1 shows the Oceanic Niño Index (ONI), a 3-month running mean of sea-surface temperatures (SSTs) in the Niño3.4 region, from January 2007 through February 2019. El Niño developed late in the season, with the Climate Prediction Center issuing an El Niño advisory in mid-February. Warmer than normal SSTs in the equatorial Pacific developed in early fall, as indicated in Figure 1, but the atmosphere was slow to show signs of El Niño. The evolution of the SSTs during the “late blooming” El Niño was actually fairly similar to the one that occurred in 2014-15. The following year, 2015-16, was a strong El Niño event, which may portend another El Niño for next winter. The official forecasts reflect that, and indicate a higher likelihood (~50%) of El Niño conditions by Oct-Dec 2019 compared to neutral (~40%) or La Niña (~10%). There will be more confidence in the ENSO forecasts later this summer.
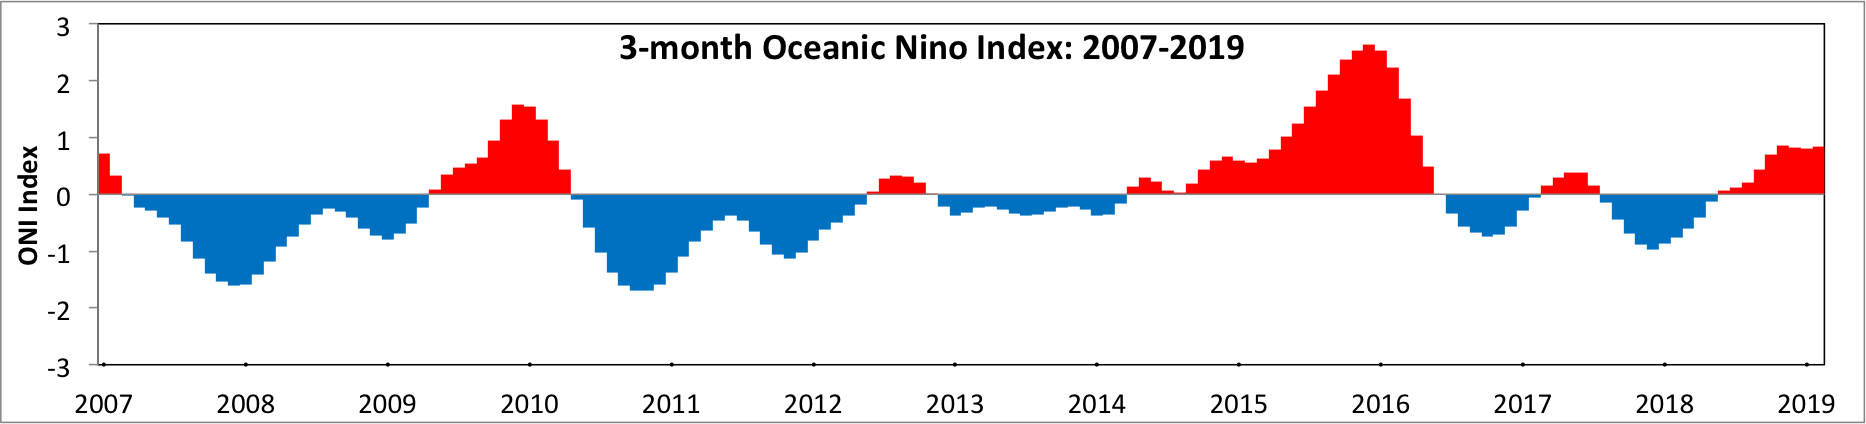
Figure 1: The 3-month Oceanic Niño Index centered over the middle month from January 2007 through February 2019. Please click on the figure to see the full-size image.
Because the El Niño developed later in the winter than expected, it is unlikely that the event had much influence on our local weather. Average statewide October-March temperatures were near-normal (35.9°F; -0.8°F anomaly from 1981-2010), but on the cool side. Figure 2a shows a larger area of eastern WA with temperatures between 2 and 4°F below normal, while most of western WA was within 1°F of normal. For precipitation, most of the state was drier than normal (Figure 2b) and the average over the state was 5.41″ drier than the 1981-2010 normal. The exception is eastern WA where precipitation was near-normal or above normal (in Benton and Franklin counties).
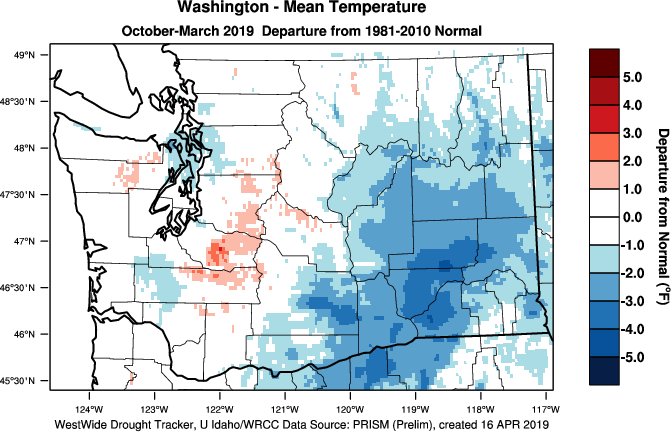
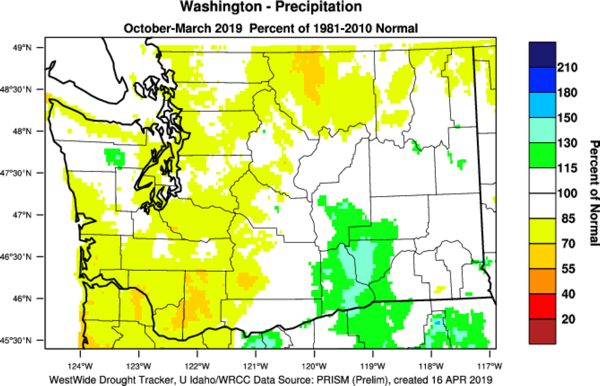
Figure 2: Oct-Mar 2018-19 average temperature anomalies (top) and precipitation percent of normal (bottom) compared to the 1981-2010 normal (WestWide Drought Tracker).
There was a substantial amount of variability in temperatures over the winter, and the distinction is worth noting here. The individual months from October to January were generally warmer than normal (+1.9°F anomaly), with the 4-month statewide average temperature ranking as the 12th warmest on record (since 1895). On the other hand, February and March were much colder than normal (-6.2°F anomaly), tying as the 5th coldest Feb-Mar averaged over the state. Figure 3 shows the temperature anomalies for these two periods.
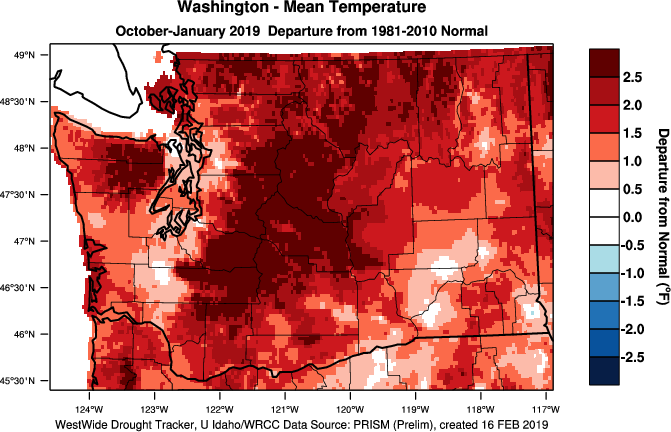
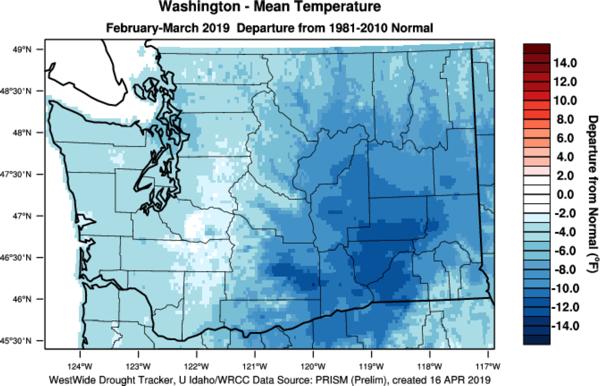
Figure 3: October 2018-January 2019 average temperature anomalies (top) and February-March 2019 average temperature anomalies (bottom) compared to the 1981-2010 normal (WestWide Drought Tracker).
The average winter conditions provide one perspective on the past winter, but it is also worthwhile to consider the progression of the weather over the course of the season, and the notable weather events. October temperatures were near-normal to above normal, while precipitation was quite variable throughout the state. November was warmer and drier than normal, with mountain snow starting off slowly. The weather pattern was more active in December (which included an EF2 tornado and a western WA wind storm), helping to build snowpack, though most locations had less snow than normal at the end of the month. December temperatures were warmer than normal, especially in eastern WA, and the warmer than normal temperatures continued into January. January was also dry for a majority of the state, except for parts of the Lower Columbia Basin where precipitation was above normal. Still, mountain precipitation was certainly below normal and snowpack was in poor shape by the end of the month. February produced some improvements with one heavy mountain snow week, in particular, that helped build our snowpack. Lower elevation snow was also plentiful during February and temperatures were much below normal statewide. But, precipitation was largely below normal with the exception again being most of the southern regions of eastern WA. In contrast, March precipitation was consistently below normal across the entire state. This dry period resulted in below normal snowpack by April 1, the traditional peak in snow accumulation for the season, despite the relatively cool conditions experienced statewide in March.
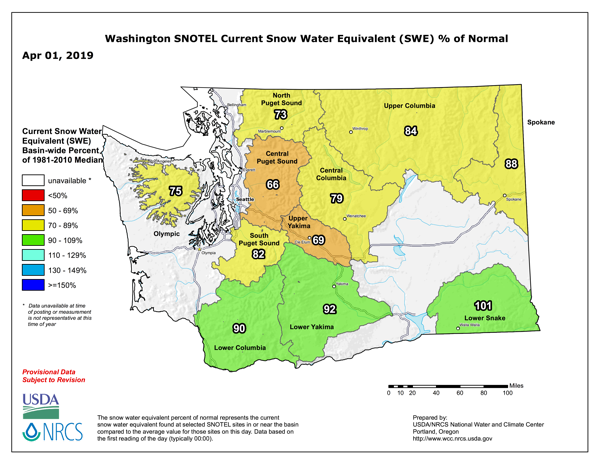
Figure 4: Snowpack (in terms of snow water equivalent) percent of normal for WA as of April 1, 2019 (from NRCS). Please click on the figure to see the full-size image.
The April 1 basin-average snow water equivalent (SWE) percentages of normal are shown in Figure 4 from the Natural Resources Conservation Service. The basins with below normal SWE ranged from 66% of normal in the Central Puget Sound to 88% of normal in Spokane. The basins across southern WA were near-normal, ranging between 90 and 101% of normal. Given below normal precipitation and snowpack in parts of the state combined with dismal summer streamflow forecasts, Governor Inslee declared a drought emergency on April 4 in 3 watersheds: the Okanogan, Methow, and Upper Yakima. Despite some recent April precipitation, the Northwest River Forecast Center’s April-September water supply forecasts are still below normal for many of our streams. Figure 5 shows those forecasts as of April 18, and note that the water supply percentages of normal for north central WA are particularly low (between 56 and 71% of normal).
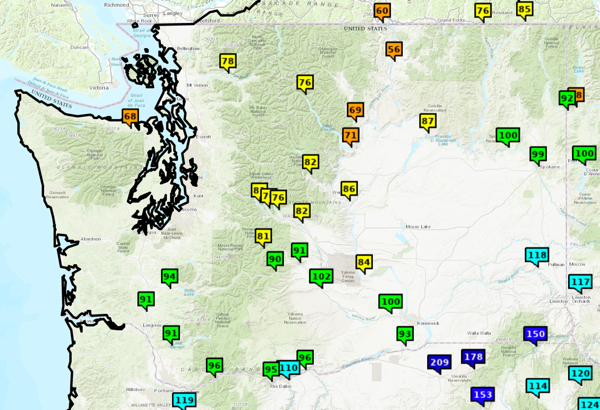
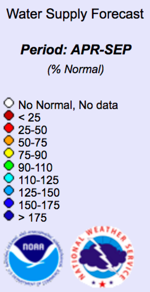
Figure 5: April through September 2019 water supply forecast in percentage of normal for WA as of April 18, 2019 from the National Weather Service Northwest River Forecast Center.
In summary, the seasonal forecasts did a good job of anticipating the warmer and drier than normal early winter, but missed the mark regarding the temperatures in February and March. Overall, precipitation was below normal for most of the state, as predicted, though perhaps not for the right reasons (since El Niño developed late in the season). Even though the snowpack accumulation season is officially over, we will continue to monitor conditions. As highlighted in the April newsletter, mountain temperatures are closely related to the rate of snowmelt in spring and with the Climate Prediction Center forecasting a warmer and drier spring and summer, there are concerns that there may not be adequate water for agriculture, recreation, and fish later in the summer. Based on current conditions and forecasts, it is especially likely that unwelcome consequences of the dry winter will occur in the Okanogan and Methow regions of the state.
Le médicament est contre-indiqué chez les patients atteints de neuropathie optique ischémique. Le médicament n’est pas associé aux nitrates – médicaments pour le traitement Tadalafil des crises d’angine de poitrine dans les maladies cardiaques ischémiques.