A Review of Winter 2017-2018
5/4/2018
Seasonal weather forecasts from the Climate Prediction Center made in fall 2017 for the winter of 2017-18 were generally indicating cool and wet conditions, in line with the expected La Niña development. Did that actually occur in WA State? Here we review the winter of 2017-18, defined as the 6 months from October through March.
Figure 1 shows the sea surface temperature (SST) anomalies from January 2008 through March 2018 in the Niño3.4 region of the equatorial Pacific Ocean. SST anomalies exceeded -1°C for the winter, classifying it as a La Niña winter. It was a stronger La Niña than the winter of 2016-17; it turns out that it is fairly common to have two back-to-back La Niña winters. La Niña is currently weakening in terms of both its atmospheric and oceanic signatures, and near-neutral conditions are expected for this spring and summer. At the time of this writing, there is about an equal chance (40-45% each) of either neutral conditions or El Niño conditions for Fall 2018. There will be more confidence in the ENSO forecasts later this summer.
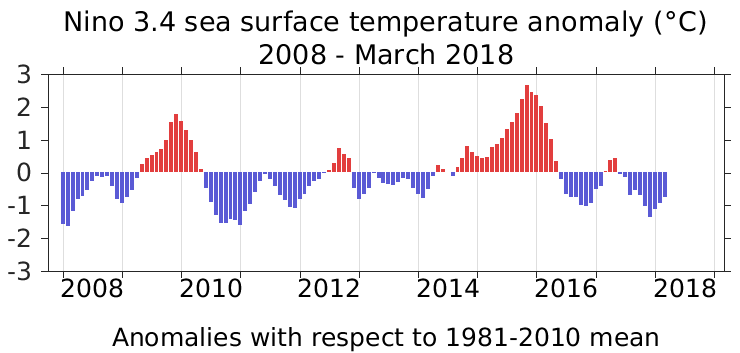
Figure 1: SST anomalies from January 2008 through March 2018 in the Niño3.4 region of the tropical Pacific (figure by Todd Mitchell – JISAO).
Average statewide October-March temperatures were exactly normal (36.7°F; 0.0°F anomaly from 1981-2010), and most regions were near-normal as well. Figure 2a shows a few areas in central WA with warmer than normal temperatures, but otherwise Oct-Mar temperatures were within 1°F of normal. For precipitation, most of the state was wetter than normal (Figure 2b) and the average over the state was 3.11” wetter than the 1981-2010 normal. The exception is the majority of Yakima county, where winter precipitation was below normal.
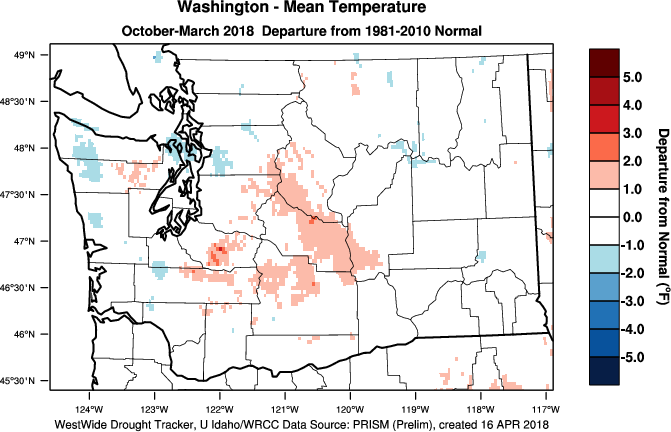
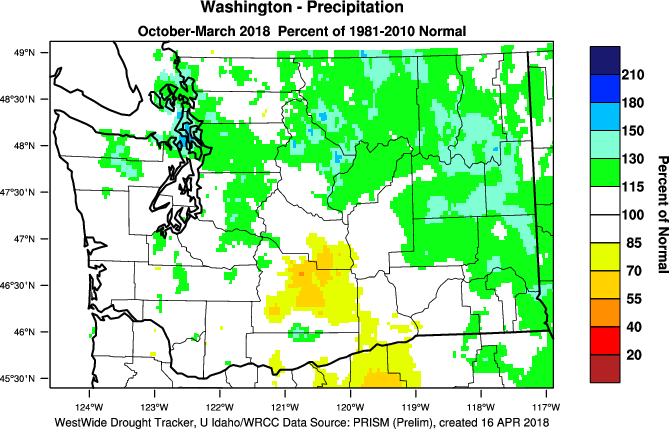
Figure 2: October-March 2017-18 (a) temperature anomalies and (b) precipitation percent of normal compared to the 1981-2010 normal (WWDT).
The average winter conditions provide one perspective on the past winter, but it is also worthwhile to consider the progression of the weather over the course of the season, and the notable weather events. October was colder and wetter than normal, with the interesting distinction that the above normal precipitation was largely due to a few very wet days. Regardless, the precipitation helped alleviate some of the areas of dryness that were depicted on the US Drought Monitor resulting from the warm and dry summer of 2017. Wetter than normal conditions continued in November, and any areas of dryness depicted on the Drought Monitor were gone by mid-month. Overall, November had near-normal temperatures, but consisted of a very cold start (with lowland snow to boot) and an anomalously warm ending. For December, an area of high pressure set up over the region causing an inversion that brought cold temperatures to the lowlands and warmer than normal temperatures at higher elevations. The pattern was so persistent that that temperature pattern was evident on the monthly scale. December was also drier than normal due to the blocking ridge suppressing the usual parade of landfalling storms. The inversion moved out of our region in time for a return to more active winter weather, including snow on Christmas Day for nearly the entire state – a rare occurrence, especially for western WA. January was warmer and wetter than normal for a majority of the state while February’s precipitation was variable and temperatures colder than normal. There were also several occurrences of lowland snow during February, and in many parts of the state the coldest temperatures of the season occurred in late February. The colder than normal conditions persisted through March, which was also drier than normal except for north central WA.
The winter conditions were consistently favorable for high elevation snow as well (aside from the stagnant air conditions in December), and the April 1 snow water equivalent (SWE) was normal to above normal throughout the state (Figure 3). Mountain snows can cause closures of the state’s highways crossing the Cascades due to avalanche risk and control, but fortunately, these types of closures were minimal during the winter of 2017-18. The healthy snowpack has aided in a favorable April-September water supply forecast from the Northwest River Forecast Center. Figure 4 shows the forecast made on April 27 indicating normal to above normal streamflow throughout WA state.
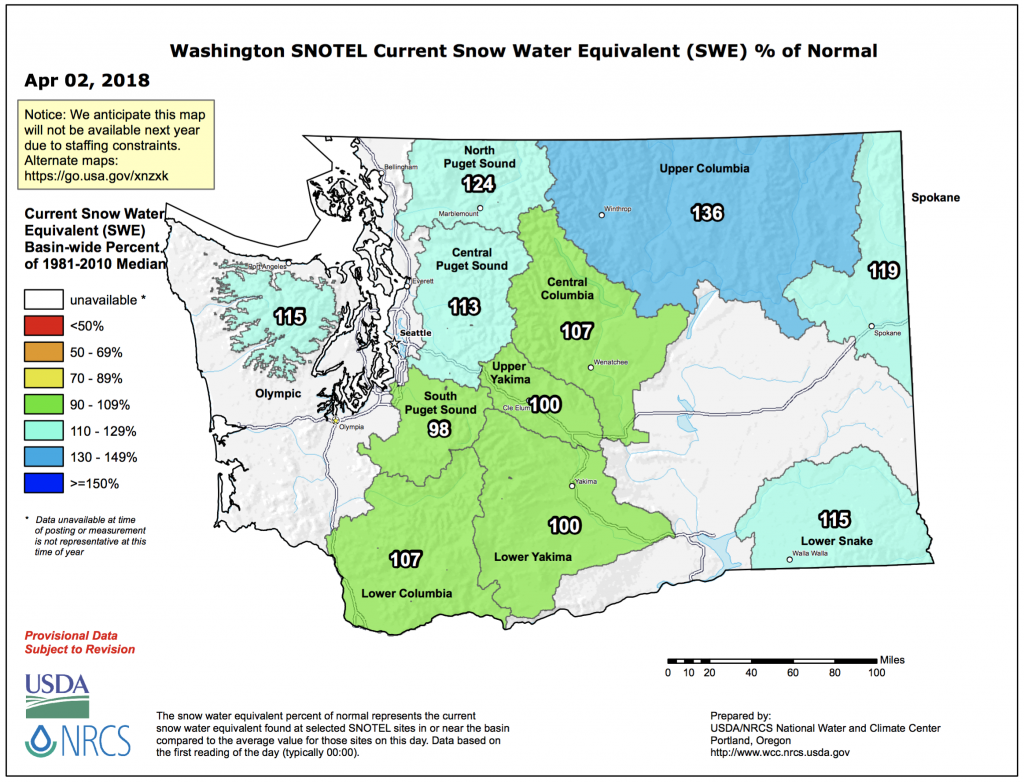
Figure 3: Snowpack (in terms of snow water equivalent) percent of normal for WA as of April 2, 2018.
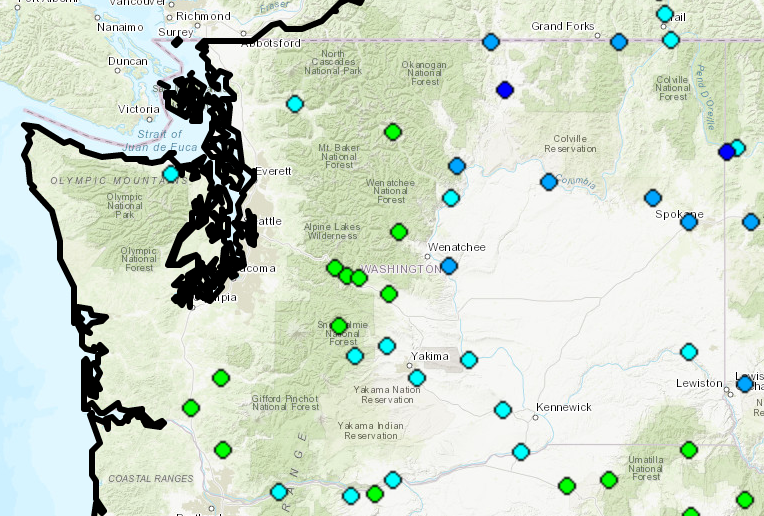
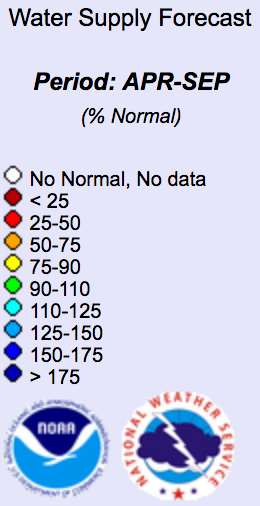
Figure 4: April through September 2018 water supply forecast for WA as of April 27, 2018 from the NWS Northwest River Forecast Center.
In conclusion, overall winter WA conditions included near-normal temperatures and above normal precipitation. La Niña in the tropical Pacific Ocean is often accompanied by a relatively wet and cool winter in WA state, but the below normal temperatures did not come into fruition. Importantly, a healthy snowpack indicates there should be plenty of water for the upcoming summer.