Heavy Rain 4-5 January 2015
1/15/2015
Very heavy rain fell in western WA State on 4-5 January 2015. The 24-hour precipitation totals for the Pacific Northwest from 4 am (12 UTC) Sunday 4 Jan through 4 am Monday 5 Jan from NOAA are shown in Figure 1. The Olympic Mountains and the coast received the heaviest precipitation in the Pacific Northwest, between 6 and 10″ of precipitation, during the 24-hour period. This summary will focus on this region after giving an overview of the event on a broader scale.
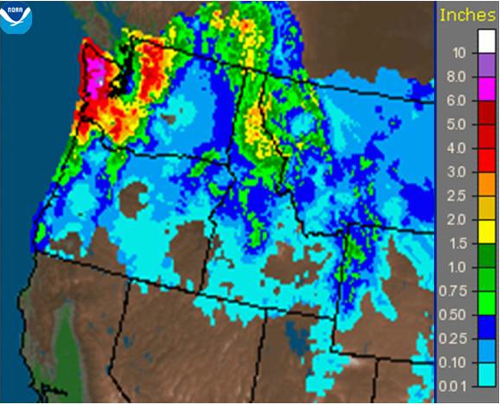
Figure 1: Total 24-hour precipitation from 12Z (4 am) 4 Jan to 12Z 5 Jan for the Pacific Northwest (NOAA).
The precipitation began on the coast between about 8 and 9 am local time (16-17 UTC) on Sunday and lasted through the morning hours Monday. The synoptic weather pattern began with low-level flow from the southwest off the Pacific in association with a small low making landfall near Haida Gwaii. Then, more westerly flow followed on the south side of a warm front accompanying another low pressure center farther offshore. There was an atypical circulation aloft for heavy precipitation in WA State. Typically, there is an extended fetch of southwesterly to westerly winds aloft. This particular case featured southerly flow west of 130 W from deep in the subtropics to around 50 N with a sharp right turn, resulting in upper-level (e.g. 500 hPa) winds from the west-northwest over the Pacific Northwest. Temperatures were mild, especially on 5 January, with a majority of western WA locations recording high temperatures well into the 50s. An interesting record was set for this storm in the precipitable water (PW) value – the total amount of water vapor in a vertical column of the atmosphere – at Quillayute. The 4 am (12 UTC) 5 January sounding at Quillayute Airport featured a value of 1.31″ for the PW, which is an impressive record-high amount for the months of December through April. In other words, this was an extremely moist system.
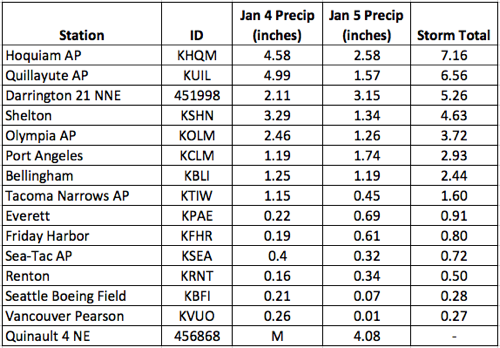
Table 1: Daily and storm total precipitation (inches) from stations in western WA and the north Cascades that measure from midnight-to-midnight. Please click on the table to see the full-size image.
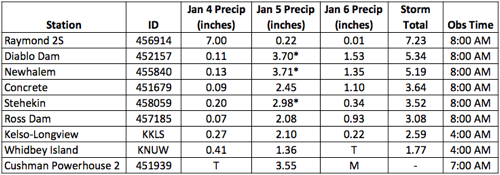
Table 2: 24-hour precipitation amounts (inches) from stations in western WA and the north Cascades that measure at various times in the morning. *Note that some of this precipitation fell as snow. Please click on the table to see the full-size image.
Tables 1 and 2 itemize a sample of daily and storm precipitation totals for western WA and the north Cascades. Note that the tables are separated because of the different times of observation for the stations. An interesting aspect of this storm was the rainshadowing by the Olympics that occurred in the Seattle-area due to the westerly flow. An example radar image in Figure 2 shows one of the many instances of this effect during this heavy rain event. As a result, 2-day precipitation totals were unimpressive for the Seattle metro area with as little as 0.28″ in the gauge at Boeing Field. Storm totals were the highest for the coast, with Raymond 2S (located south of Aberdeen near the Willapa Bay), Hoquiam, and Quillayute receiving 7.23″, 7.16″, and 6.56″ over the storm period, respectively. Volunteer precipitation observers confirmed these high precipitation amounts in Grays Harbor County as the 24-hr precipitation totals ending the morning (between 7 and 9 am) of 5 January show precipitation between 4.25 and 8.85″ (Figure 3). Another nearby station – Humptulips Salmon Hatchery located north of Aberdeen on Rt. 101 – won top honors, receiving a remarkable 10.26″ of precipitation in the 24-hours ending at 10 pm on 5 January.
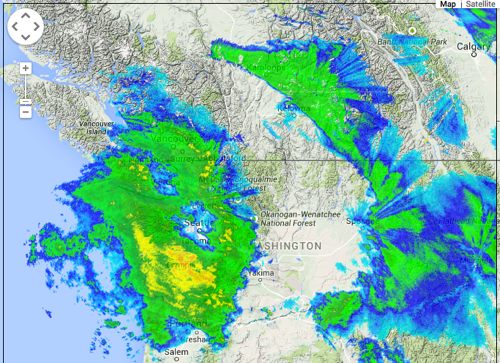
Figure 2: Composite radar image from 4 January at 10:03 pm local time (from UW Atmos Sci). Please click on the figure to see the full-size image.
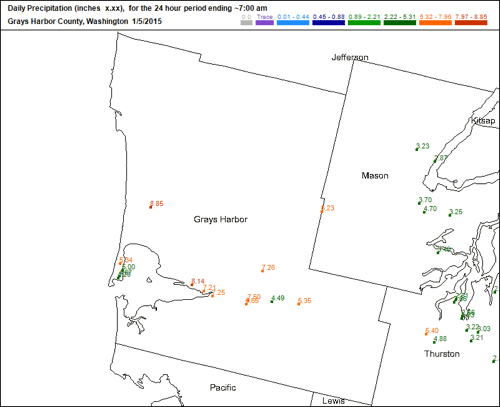
Figure 3: 24-hr precipitation totals for Grays Harbor county on the morning of 5 Jan from CoCoRaHS observers. Please click on the figure to see the full-size image.
The large precipitation amounts inspired a look back at the records. We focus on the 3 coastal stations with the most precipitation: Raymond, Quillayute, and Hoquiam. The event was the most prominent in the Hoquiam record, ranking as the 3rd wettest 1-day precipitation total (4 Jan) and the wettest 2-day precipitation total on record. These stats are based on a 62-year record beginning in 1953. For Raymond, a station that’s only been recording since 1980, the stats can be a little misleading; the 4 January precipitation ranks as the wettest 1-day total and the 2-day precipitation total ranks as the 5th wettest. The event was not nearly as impressive when examining the long-term record at Quillayute (49 years). The 4 January precipitation was the 10th wettest 1-day total and the 2-day precipitation total did not make the top 20.
We estimated return intervals for these stations by fitting a log-normal Pearson Type-3 distribution to the period-of-record precipitation amounts. Keep in mind that determining return intervals of an event is constrained by the length of reliable data, yet fitting a distribution curve to the data allows us to estimate the return interval beyond the length of the record. For Hoquiam, the 2-day precipitation total ranked as a 100-year event (Figure 4), which means there is only a 1% chance that a 2-day total will equal or exceed this amount in any particular year. The 1-day total on 4 January constitutes a 40-year event for Hoquiam. On the other hand, the event ranked as only a 5-year event at Quillayute for the 4 January total precipitation and between a 3 and a 5-year event for the 2-day precipitation. The short record at Raymond makes those return period estimates less reliable, but even with a short record, the 2-day precipitation total was only estimated as a 10-year event. There were 4 other fairly recent occasions (6-7 Jan 2009, 5-6 Nov 2006, 7-8 Feb 1996, and 23-24 Nov 1986) in which the 2-day precipitation exceeded what fell during Jan 2015 event.
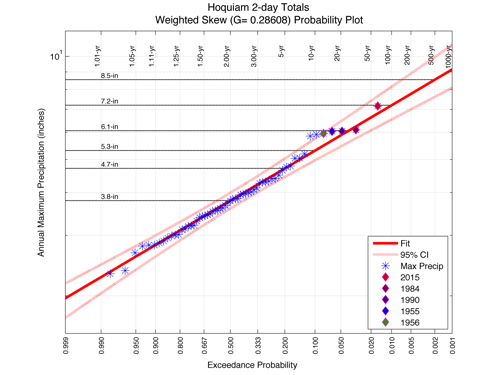
Figure 4: Return interval estimate using a log-normal Pearson Type-3 distribution on the largest 2-day precipitation totals for the Hoquiam station for the period of record (1953 to 2014). This function and plot has been modified from an original USGS program. Please click on the figure to see the full-size image.
As illustrated in this report, the return intervals for the storm on 4-5 January 2015 vary greatly depending on location and station record. The event was much more unusual at Hoquiam (100-yr event) than at Quillayute (3- to 5-yr event) or Raymond (10-yr event). Regardless of how often these types of events occur in the historical record, the amounts were considerable, and sufficient to cause major impacts such as flooding and landslides. In addition, a winter record was set at the Quillayute sounding for high PW content. The event is one that other occurrences of heavy rainfall will undoubtedly be compared to in the future.
