A Review of Winter 2009-2010
May 2010
The winter of 09-10 was anticipated to be warmer and drier than normal in the Pacific Northwest due to the expected development of a moderate El Niño. Did that actually happen? This report summarizes the conditions experienced in WA during this winter, and compares the conditions to previous El Niño years. For the purpose of this summary, winter is defined as November through March.
A moderate El Niño event developed in the fall of 2009 and persisted through the winter. The sea surface temperature anomalies from 2000 through 2010 in the Niño 3.4 region of the tropical Pacific Ocean (Figure 1) indicate that this event was of similar strength to the 2002-2003 El Niño. Historically, the Pacific Northwest experiences drier and warmer winters during a positive El Niño/Southern Oscillation (ENSO) event. True to form, this winter was warmer and drier than normal in WA. Mean temperatures were between 1 and 3 degrees F above normal for each of the WA climate divisions (Figure 2) and precipitation totals were between 4 and 13 inches below normal for the western half of the state and between 1 and 4 inches below normal for the eastern half. The Olympic Peninsula was an exception with near-normal precipitation (Figure 3). There is a somewhat more complicated story with regards to snowpack for WA this year. Had winter been defined as only December through February, the snowpack would have been drastically below normal for the season. Fortunately, a series of late season storms in late March and early April produced a marked increase in snowpack. Some locations (i.e., Hurricane Ridge, Mount Baker, Paradise, and Timberline) got up to 45″ of new snow between March 1 and April 15 (mountain snow). By April 22, the snow water equivalent (SWE), i.e., the amount of water contained in the snowpack, rose to roughly 80% of normal for the Cascades as a whole, and actually above normal in the Olympic Mountains (Figure 4). On the other hand, the SWE remained considerably below normal in the Spokane and Lower Snake regions in the eastern portion of the state.

Figure 1: SST anomalies from 2000 through 2010 for the Nino 3.4 Region of the tropical Pacific. Figure created by Todd Mitchell. Please click on the figure to see the full-size image.
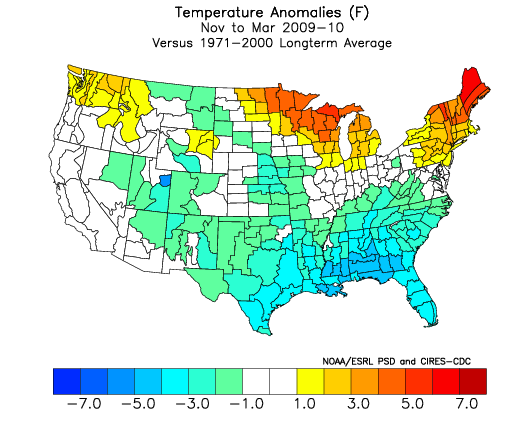
Figure 2: Winter temperature anomalies (Fahrenheit) across the US for 2009-2010 winter. Departures taken from the 1971-2000 normal.
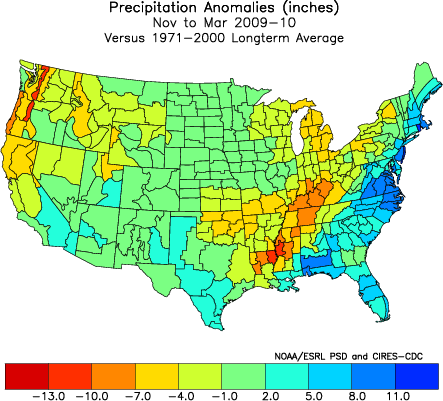
Figure 3: As in Figure 2, but for precipitation (inches).
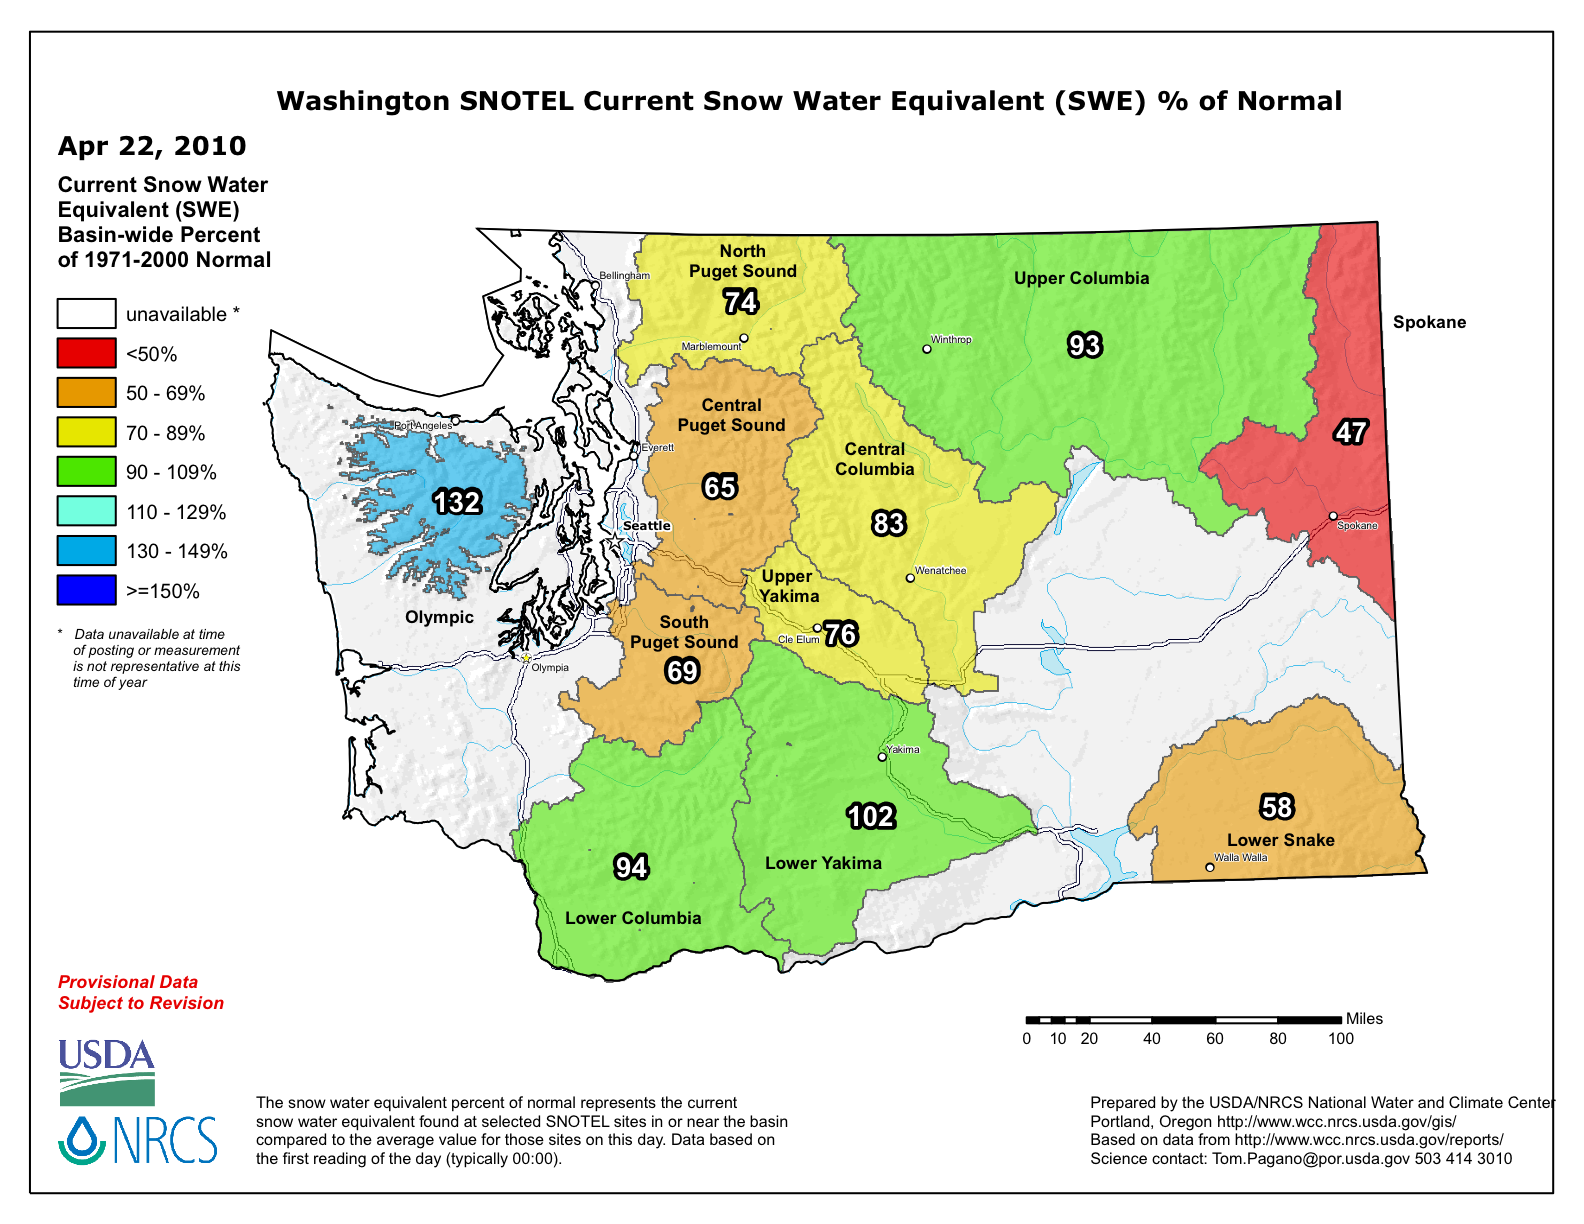
Figure 4: Snow water equivalent percent of normal for WA as of April 22, 2010 from NRCS. Please click on the figure to see the full-size image.
While the average winter conditions characterize what the season was like in general, a closer look at the sub-seasonal variations is needed to understand how the winter unfolded. A telling example of this is west side precipitation in November. It was actually very wet west of the Cascades, which differed from the general winter conditions. Total November precipitation was 26.55″ at Quillayute and 18.93″ at Hoquiam, for example, ranking as the 2nd wettest November at each station. The heavy rains in the low elevations meant snow in the mountains, and the Olympics and Cascades started off with above normal snow water equivalent. In contrast, eastern WA was very dry in November, as reflected by the unusually slow growth of the snowpack in the Blue and the Selkirk Mountains.
The greatest deviation from the warmer than normal winter temperatures came in early December, when an arctic air mass plunged into the state and kept temperatures at record daily lows for days at a time. Overnight lows in Olympia even dipped into the single digits for 3 consecutive days, and some overnight lows in eastern WA were below zero [Fahrenheit]. Overall, December was colder than normal by about 2 to 5 degrees F. Precipitation was also below normal for December, and even with the cold temperatures, snowpack did not build at a typical rate in the mountains. January, on the other hand, was especially warm, with temperatures anywhere from 5 to 9 degrees F above normal around the state. For many stations, January 2010 was among the warmest on record. Precipitation was below normal for the Cascades and northeastern WA, but close to normal for the lower elevations west of the Cascades. Precipitation was also above normal for parts of the Olympic Peninsula and for much of eastern WA (Figure 5). The January precipitation pattern is different than what is usually seen, and Figure 6 shows the 850 hPa mean vector wind for the month. The winds were generally out of the south, instead of the more westerly flow that is typical for this time of year. The southerly winds meant enhanced transport of moisture into eastern WA, and up the south-facing slopes of the Olympic Mountains, but also a reduction in the usual flow up the western flanks of the Cascades. The overall flow pattern was also conducive to low pressure storm systems tracking more parallel to the coast than onshore, with one consequence being an absence of strong winds in the populated regions of the Puget Sound.

Figure 5: January percent of normal precipitation for WA from the High Plains Regional Climate.
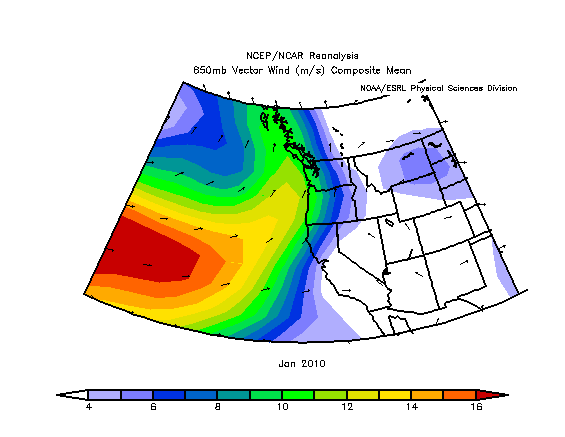
Figure 6: 850 mb vector mean wind for January 2010 from ESRL.
February and early March were warmer than normal, and dry for most of the state. A few locations in eastern WA such as Wenatchee and Omak did receive above normal precipitation for that period. More information about each month is given in our monthly newsletters. The overall warm winter temperatures and low precipitation not only led to low snowpack, but also to less lowland snow than normal this winter. Spokane only received 14.4″ and SeaTac Airport only recorded a trace, with normals of 46.8″ and 8.1″, respectively.
Seemingly in defiance of the calendar, a series of winter-like storms moved through WA in late March through April, and as mentioned above, brought some much-needed snow to the mountains. Nevertheless, the water supply forecast issued on April 22 is not promising though due to the deficit of precipitation earlier in the season. Figure 7 shows the summer streamflow forecast for the Pacific Northwest from the Northwest River Forecast Center and the forecasts range from as little as 25 to 90% of normal.
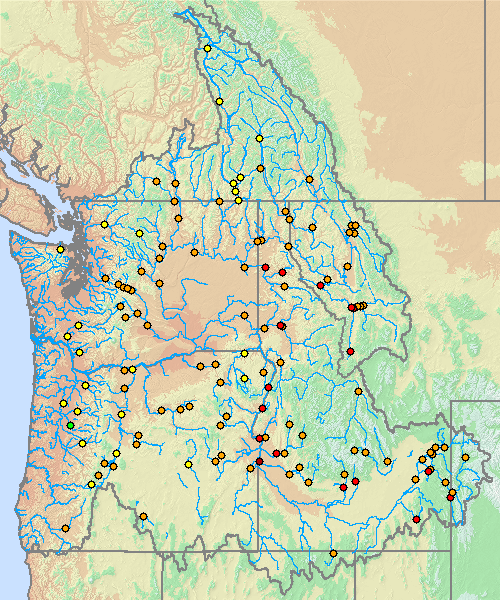
Figure 7: Summer water supply forecast for the Columbia Basin from the Northwest River Forecast Center.
Returning to the subject of El Niño, it is worthwhile to consider how the past winter’s weather corresponds with that associated with past events. Figures 8 & 9 show the composite temperature and precipitation anomalies for past El Niño events as defined by Bond and Harrison (2006). Compared to Figures 2 & 3 [note that the color scales are different], the temperature anomalies in WA this past winter were consistent with the composite El Niño signal. The precipitation anomalies do not match quite as well with the Cascades being drier, and the Olympics being wetter than in the composite of previous El Niños. The difference can be attributed to southerly flow, which was enhanced not just during January, but also for the winter as a whole. While the temperature and precipitation anomalies in WA were more-or-less consistent with those expected during an El Niño, it is worth noting that this was not necessarily true for other areas of the United States. The northeast US, for example, was warmer this winter than usual during El Niño, and California had near-normal rather than relatively heavy precipitation. These discrepancies are consistent with the continental scale atmospheric circulation, which is summarized here with 500 hPa geopotential height anomaly maps for the past winter (Figure 10) and for the composite of past El Niños (Figure 11). Specifically, the much higher than normal 500 hPa geopotential heights over eastern Canada were associated with anomalous easterly flow over the northeastern US and a suppression of arctic-air outbreaks out of central and western Canada (if not a lack of some crippling snowstorms). Furthermore, the lower than normal 500 hPa heights over the eastern North Pacific did not extend as far as usual towards southern California, resulting in a typical rather than especially stormy winter. Though we will not go into detail here, the Arctic Oscialltion (AO) was extremely negative this past winter, and likely played a role in the deviations from a typical El Niño weather pattern in parts of the US.
At the time of this writing, El Niño is winding down. The consensus of the models used to forecast ENSO indicates near-neutral conditions are likely to prevail for a least the next couple of seasons, though the forecasts made at this time of year have less skill than those made during the summer. More information will be known about the predicted winter ENSO state in the next few months. Still, since it appears that ENSO is unlikely to influence our weather one way or another, one might suppose that implies normal weather ahead. Maybe so, but it is worth emphasizing that the mid-latitude atmosphere can generate substantial and long-lasting anomalies on its own, and only time will tell how this will play out in terms of the weather for Washington state.
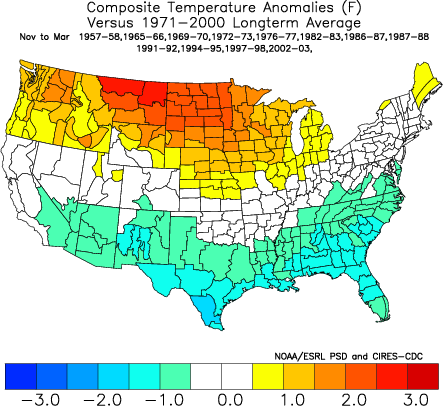
Figure 8: Composite Nov-March temperature anomalies (Fahrenheit) during El Niño (defined in Bond and Harrison, 2006).
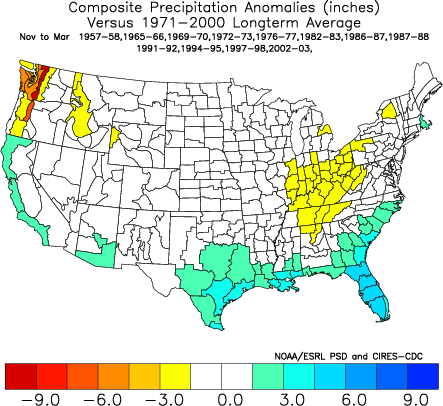
Figure 9: As in Figure 8, but for precipitation (inches).
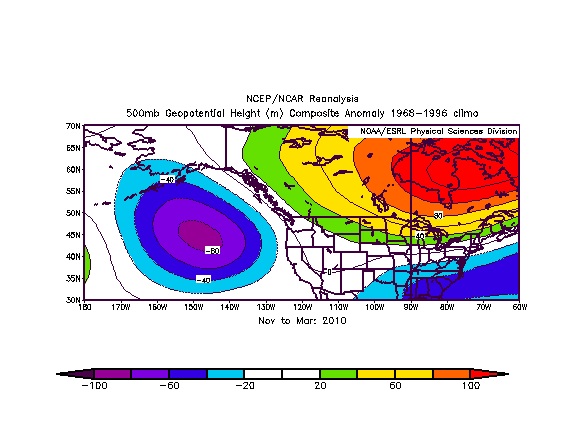
Figure 10: 500 hPa geopotential height anomalies from November through March 2010 from ESRL.
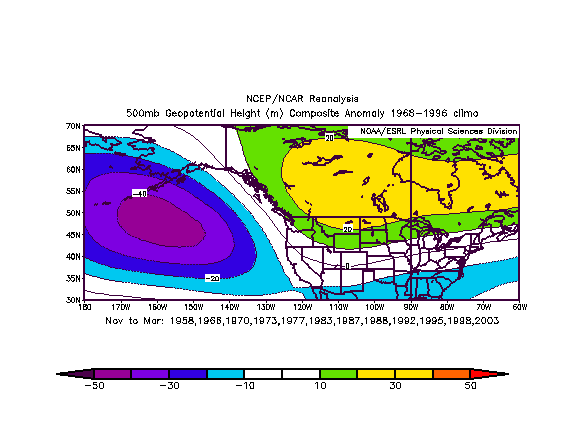
Figure 11: 500 hPa geopotential height anomalies from November through March for past El Niño events (defined in Bond and Harrison, 2006) from ESRL.
Reference
Bond, N.A., and D.E. Harrison (2006): ENSO’s effect on Alaska during opposite phases of the Arctic Oscillation. International Journal of Climatology, 26, doi: 10.1002/joc.1339.