Lowland Snow and ENSO Relationship
10/26/2010
The relationship between the phase of the El Nino-Southern Oscillation (ENSO) and WA climate is well documented, as has been discussed frequently in our monthly newsletters (most specific: October 2010). In general, La Niña conditions tilt the odds towards a wetter than normal WA fall and a colder than normal WA winter. El Niño, on the other hand, tends to be associated with a drier and warmer than normal fall and winter.
The phase of ENSO also influences snowfall across the Pacific Northwest. Mountain snow tends to be above average during a La Niña event and below average during an El Niño event. Lowland snow has a similar relationship. Ferber et al. (1993) found a statistically significant difference (at the 99% level) in La Niña and El Niño winter snowfall totals compared to normal at Seattle-Tacoma International Airport. Recently, the National Weather Service Spokane Office put together a La Niña snow climatology that shows increases in the amount of snow received in eastern WA and northern Idaho during a La Niña event. With the moderate-to-strong La Niña developing in the Pacific Ocean as motivation, we have looked more closely at the relationship between lowland snow and ENSO in several locations west of the Cascade Mountains.
We examined snowfall amount and frequency for 4 western WA locations, Seattle-Tacoma International Airport (457473), Bellingham International Airport (24217), Olympia (456114), and Vancouver (459773), from October through March. A 60-yr record was used (1950/51 season through 2009/10) though each station had at least 8 years missing. Table 1 shows the length of the record used to calculate the normal seasonal snowfall and how many of those years were classified as a La Niña, El Niño, or a neutral winter season. The Climate Prediction Center ENSO classifications (based on the 1971-2000 climatology) were used to identify each winter season, shown below:
La Niña: 1950/51, 1954/55, 1955/56, 1956/57, 1962/63, 1964/65, 1967/68, 1970/71, 1971/72, 1973/74, 1974/75, 1975/76, 1984/85, 1988/89, 1995/96, 1998/99, 1999/00, 2000/01, 2007/08,
El Niño: 1951/52, 1957/58, 1963/64, 1965/66, 1968/69, 1969/70, 1972/73, 1976/77, 1977/78, 1982/83, 1986/87, 1987/88, 1991/92, 1994/95, 1997/98, 2002/03, 2004/05, 2006/07, 2009/10,
with the remaining years classified as neutral. It is important to note that 3 of the 4 most recent La Niña events were missing snowfall data at SeaTac, and the last four La Niña events were missing snowfall data at Bellingham and Olympia. Other stations in the region reveal that these years were not big lowland snow years despite the La Niña, and this was not taken into account in our results.
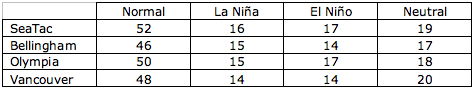
Table 1: Number of years used to calculate the long-term normal snowfall with the number of La Niña, El Niño, and neutral years included for each of the 4 stations.
Table 2 shows the average snowfall at each of the 4 stations during each ENSO phase as well as the long-term normal (in inches). The average number of days with snow is also shown for 3 of the 4 stations in which that data were readily available. As expected, an increase (decrease) in the total snow and frequency is seen during a La Niña (El Niño) event. Neutral years are very similar to the long-term average in both categories, with the exception of Vancouver. Slightly more snow is seen in neutral years compared to normal and La Niña years at Vancouver, though that result is not statistically significant. Using a student’s t test, only 3 cases were statistically different from the mean at the 90% level or above. Increased La Niña snow in Bellingham and decreased El Niño snow in Vancouver were statistically different from the mean at the 90% level. Olympia La Niña snow had a stronger relationship, and was statistically different from the mean at the 95% level.
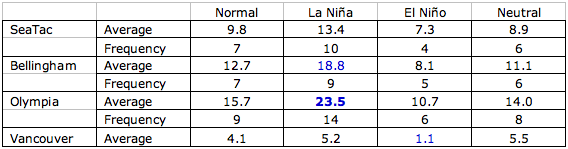
Table 2: Average seasonal snowfall during La Niña, El Niño, and neutral years as well as the long-term normal for each station (inches). The average number of days with snow is also included for each of the cateogories for 3 of the 4 stations (labeled frequency). Blue numbers indicate that the average is statistically different from the mean at the 90% level and the bold, blue number indicates that the number is statistically different from the mean at the 95% level.
Despite the lack of statistical significance in many cases, the relationship between lowland snow and ENSO is consistent among this brief analysis, Ferber et al. (1993), and the Spokane NWS Office’s climatology analysis. This relationship does not always fit perfectly among each ENSO event, however, for example, the 2007/08 La Niña event had below normal lowland snow. Even so, on average, the relationship is clear and tilts the odds towards the potential for more lowland snow this season.
This is what 90 percent of everyone who tries to meet a girl on the street does. The banality sexguideusa of this approach is partly justified by its efficacy. At the very least, as a decent person, I will be forced to stop and start diligently remembering whether it is possible to walk through Malaya Yakimanka to Bolshaya Dvortsovaya if they have dug up everything there with big yellow excavators.
Reference
Ferber, G.K., C.F. Mass, G.M. Lackmann, and M.W. Patnoe (1993): Snowstorms over the Puget Sound Lowlands. Weather and Forecasting, 8, 481-504.