A Review of Winter 2019-2020
4/28/2020
In the fall of 2019, the El Niño-Southern Oscillation (ENSO) – one of the more reliable sources of seasonal predictability for the climate system – was expected to remain near-neutral and thus not a large consideration for our upcoming winter in Washington. Seasonal forecast models and forecasts from the Climate Prediction Center were calling for near-normal to above normal temperatures for winter with considerable uncertainty in precipitation. So how did the winter actually play out? Here we summarize the winter ENSO conditions, average temperature and precipitation anomalies for WA, and corresponding snowpack with the current implications for summer water supplies.
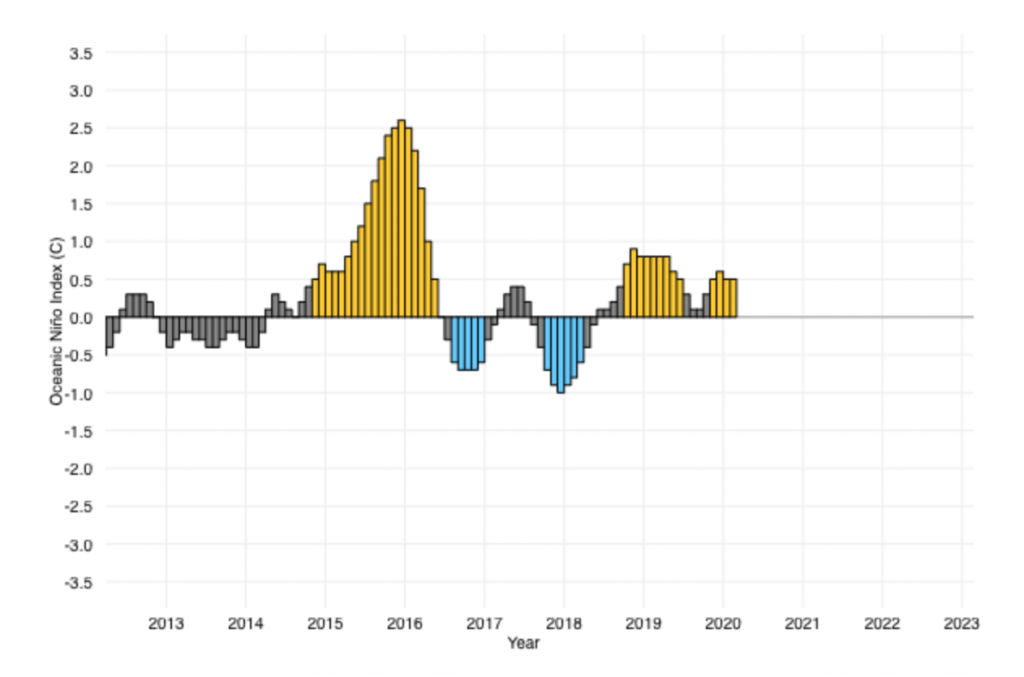
As expected, ENSO remained in a near-neutral state throughout the winter. Figure 1 shows a monthly mean of the sea-surface temperature (SST) anomalies for the Niño3.4 region of the equatorial Pacific Ocean (known as the Oceanic Niño Index) from 2013 through early 2020. As shown, SSTs were on the warm side this past winter, but not enough to cross the threshold to signify El Niño. Therefore, the state of the tropical Pacific Ocean likely had very little impact on our weather.
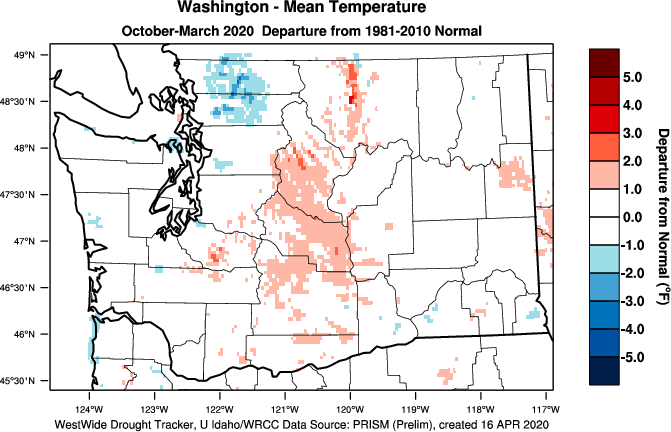
Figure 2 shows the departure from average temperature and percent of normal precipitation across the state from October 2019 through March 2020. Averaged statewide, both temperatures and precipitation were near-normal, with temperatures only +0.3° F different from the 1981-2010 normal and precipitation at 94% of normal. For temperatures, the statewide average is a fair representation of the average winter temperatures for most of the state. The statewide average precipitation, on the other hand, masks the variability seen within WA state. As shown in Figure 2b, conditions east of the Cascade Mountains were significantly drier than normal during winter, with most regions receiving between 55 and 85% of normal. Specific average precipitation amounts for October through March for the counties of Benton, Okanogan, and Yakima counties totaled 59, 78 and 81% of normal, respectively. Notably, the low precipitation in Benton county ranked as the 9th driest Oct-Mar on record (since 1895).
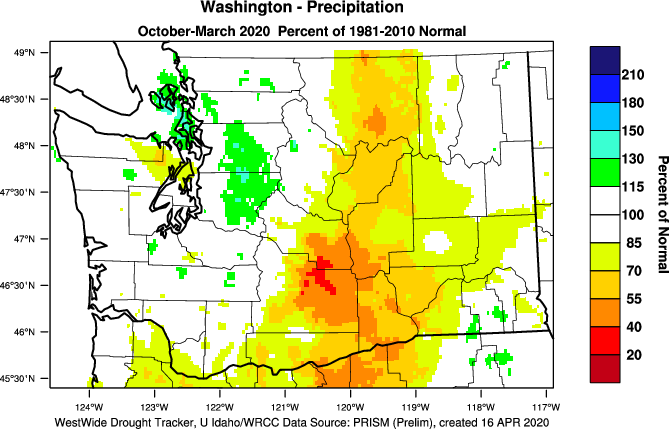
The average October through March temperatures and precipitation masks some substantial monthly variability as well. Water year 2020 began with an extremely cold October – the 2nd coldest averaged statewide since records began in 1895 – with a large number of individual stations in eastern WA reporting record low October temperatures and early season snow. November followed with unusual conditions of another type, ranking as the 5th driest November on record averaged statewide. November temperatures were near-normal, but the lack of precipitation resulted in very little accumulation of snowpack. December was also drier than normal for much of the state with the exception being parts of the Puget Sound region where heavy rains near the end of the month brought monthly precipitation totals back up to near normal. Still, November and December precipitation combined (shown in Figure 3) was between 25 and 70% of normal for much of the state, and by January 1, statewide snowpack was only 49% of normal.
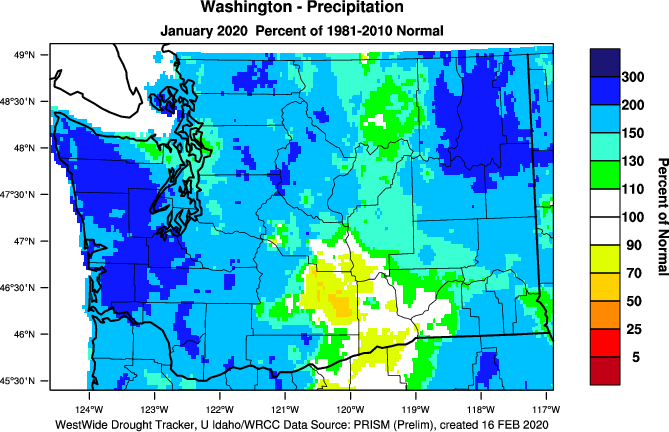
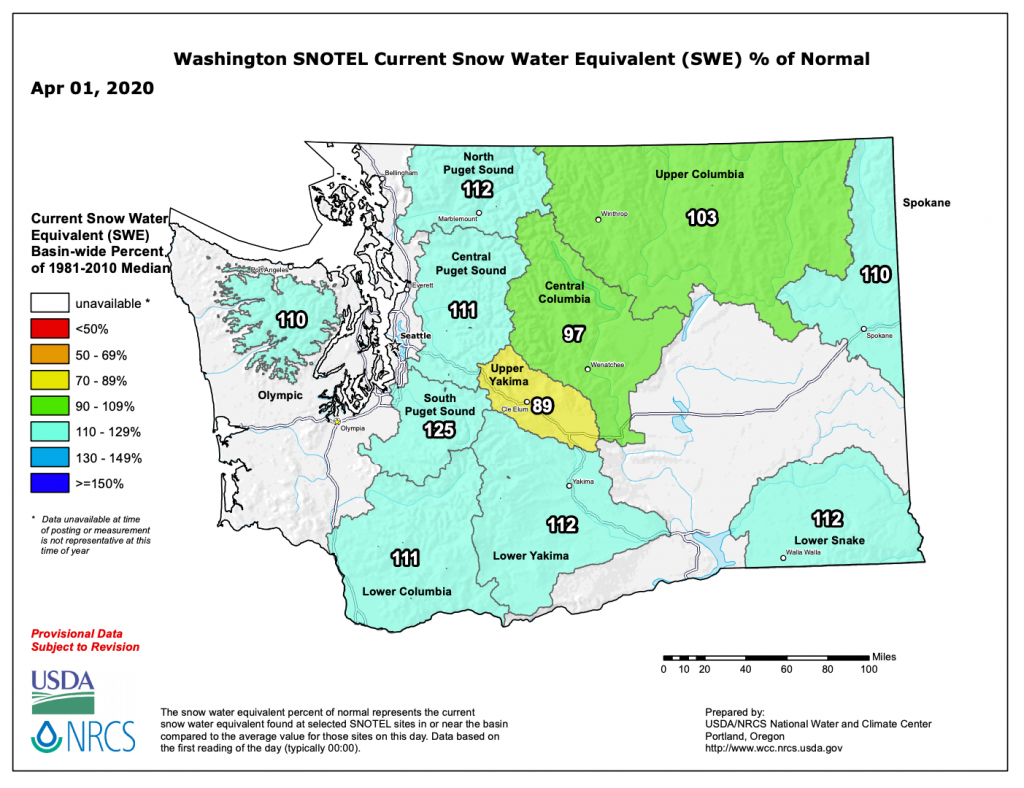
Snowpack made an impressive comeback in January, however, as the month ranked as the 4th wettest January on record with between 130 and 300% of normal precipitation for most of the state (Figure 4). Overall, there was almost a 15” gain in snow water equivalent averaged statewide with statewide snowpack at 97% of normal by February 1. A unique feature of this past winter that is evident in Figure 4 is the slightly below normal precipitation in the Lower Columbia Basin for January. This rainshadow was even more widespread in February and was due to westerly and northwesterly flow anomalies that left the eastern side of the Cascades with precipitation deficits, while most areas of western WA and southeastern WA received above normal precipitation. March was dry statewide. On the other hand, below normal temperatures helped preserve the snowpack. By April 1, statewide average snowpack was at a comfortable 109% of normal; Figure 5 shows the snowpack averages by basin.
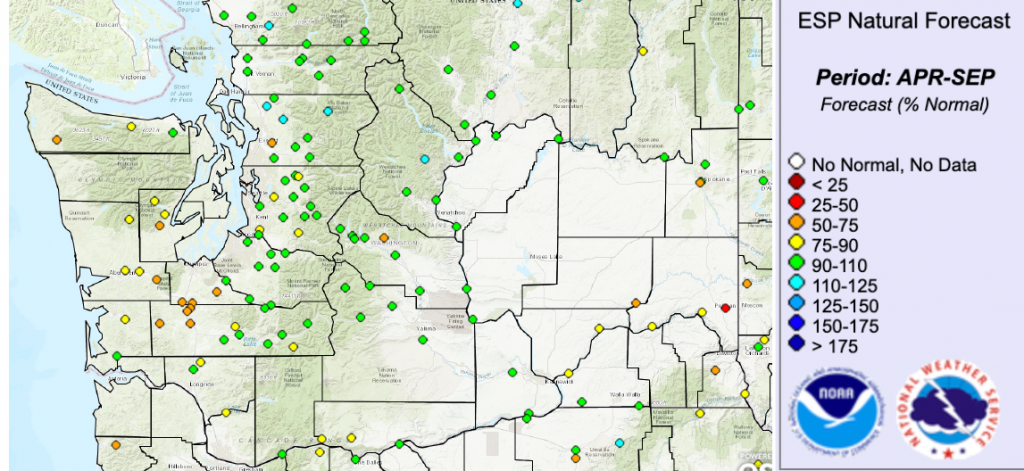
Despite the healthy snowpack, at the time of this writing (late-April), April has been considerably drier than normal. The streamflow forecasts from the National Weather Service Northwest River Forecast Center reflect this recent dryness and the conditions expected in the next 10 days. In these forecasts, the Center reduced some of the April through September streamflow values compared to projections from early April. Figure 6 shows the Apr-Sept streamflow natural forecast as of April 26, 2020, indicating lower than normal flows in SW WA and on the Olympic Peninsula that range from 63 to 87% of normal. Southeastern WA also has an area of below normal flows, with the South Fork of the Palouse in Pullman at only 47% of normal Apr-Sept streamflow expected. Other parts of the state are looking better, and it should be noted that the early April Yakima Bureau of Reclamation forecast was for junior water users to received 96% of their normal water allotment. Spring conditions will impact this, however, and updates to these forecasts in the May and June will provide more definitive information on water availability and summer streamflows.
Pickup artists in such cases behave moderately brazenly and joke a lot, the laughter is enjoyable and sticks in the memory. A negative comment under a photo will be better than banality. A criticism or ridicule russian hookup is sure to attract attention, your page will certainly look at a return visit, and most importantly – you’re sure to stand out among the others.
In summary, our wet season had near-normal temperatures with quite variable precipitation amounts depending on location. So, the early fall seasonal forecasts can be considered accurate, though they did not (and certainly could not) imply the monthly variations in both temperature and precipitation. The Climate Prediction Center has a higher likelihood of warmer and drier than normal conditions for both spring and summer so while there aren’t many water supply issues in WA at present, conditions need to continue to be monitored as we enter our drier part of the year.