July 1960 – Washington State’s Driest Month
7/8/2016
An unofficial nickname for Washington is the “Evergreen State”; the term is included on our vehicle license plates. But we actually enjoy a Mediterranean climate with wet winters and dry summers, and much of the state is more brown than green during the summer. That must have been especially true in July 1960, which appears to have been the driest month in state history dating back to the 1890s. Here we take a look at that particular month as a follow-up to our piece in this newsletter a year ago, which focused on the record warmest month of July 1985.
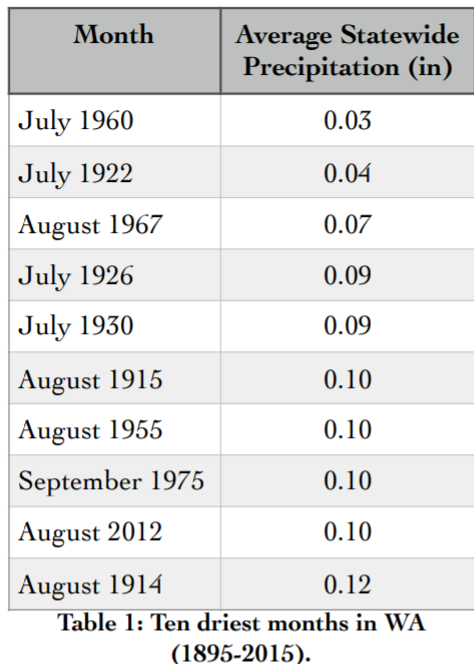
The ten driest months in WA state during the instrumental record are indicated in Table 1. The record lowest amount from a statewide perspective was 0.03” in July 1960, just under the 0.04” estimated for July 1922. These values are both less than 5% of the 20th century average precipitation during July, which is 0.90” for the state as a whole. It turns out it was actually drier on the west side of the Cascades in July 1922. But all of the climate divisions of the state were exceedingly dry in July 1960 (ranging from 0.01” in the Puget Sound Lowlands to 0.05” in the East Slopes Cascades region). Some stunningly low amounts of precipitation occurred in spots that normally get a fair amount of rain. For example, in the coastal region of WA, Forks checked in with only 0.04” and Hoquiam got completely shut out with 0.00”. The 1981-2010 climate normal for Forks and Hoquiam in July is 2.47 and 1.14”, respectively. There were some isolated locations that were wetter, of course. While we have not conducted an exhaustive review of all the possible station records, the highest totals we found were 0.48” at Paradise Ranger Station at Mt. Rainier on the west side, and 0.22” at Conconully to the east of Cascade mountain crest. El Niño-Southern Oscillation (ENSO) has only modest impacts on our summer weather, and ENSO certainly cannot be blamed for the lack of rain in July 1960. The Nino3.4 index was 0.2, and the Pacific Decadal Oscillation was -0.27. During July 1960, as well as many of the other months on the statewide driest list, these two indices commonly used to characterize the large-scale state of the climate of the North Pacific were in the neutral category.
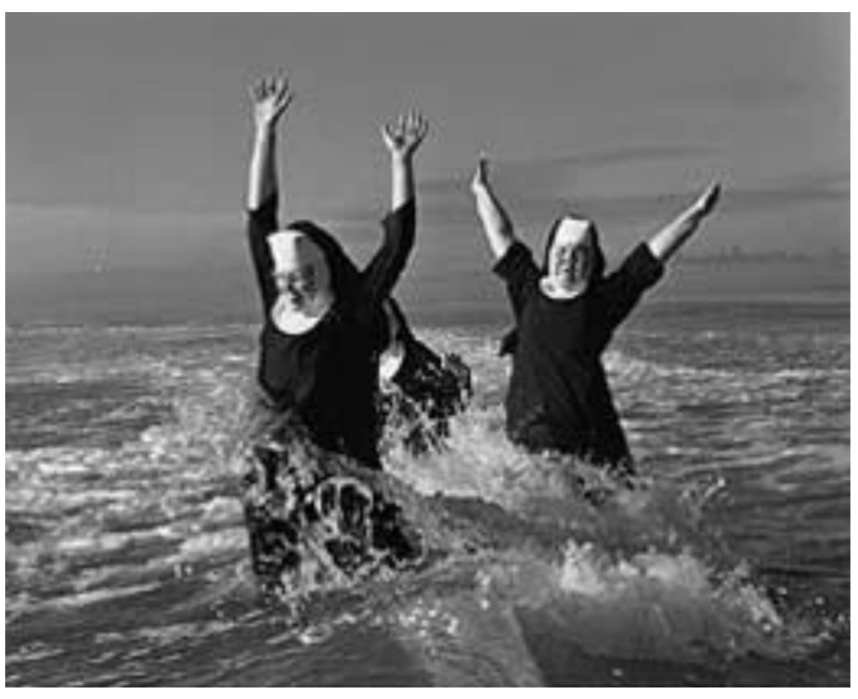
Not surprisingly, July 1960 was also hotter than normal, specifically the 12th warmest month on record. The photo shown below shows how some folks beat the heat (http://www.historylink.org/index.cfm?DisplayPage=output.cfm&file_id=5630) in Grayland, WA. The month of August 1967 also made both top-ten lists. While dry and warm tend to go hand in hand during the summer, the correspondence is not that tight with regards to extreme months. For example, the mean temperature during the 2nd driest month of July 1922 was only 1.2°F above normal, and the precipitation during the 2nd warmest month of July 1998 was actually 0.27” above normal.
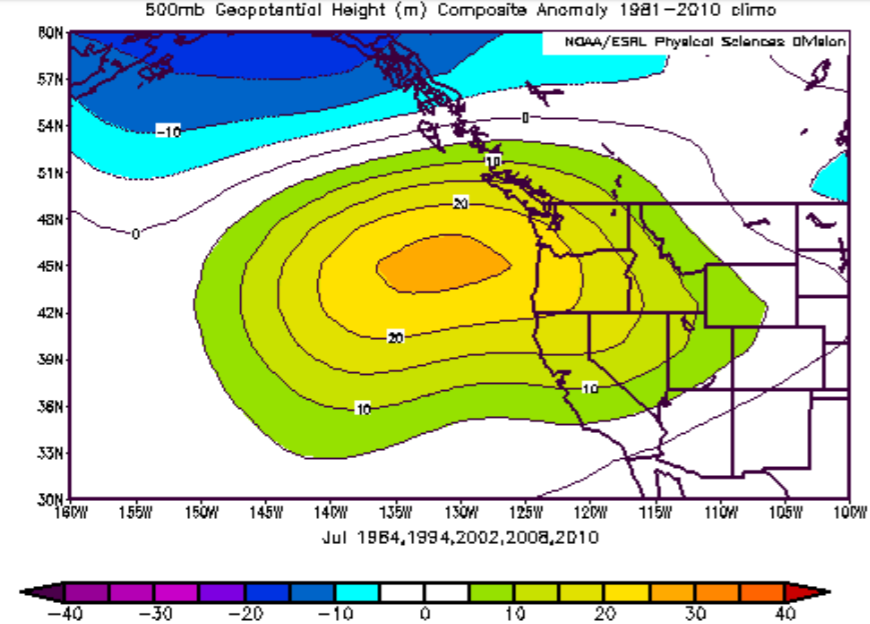
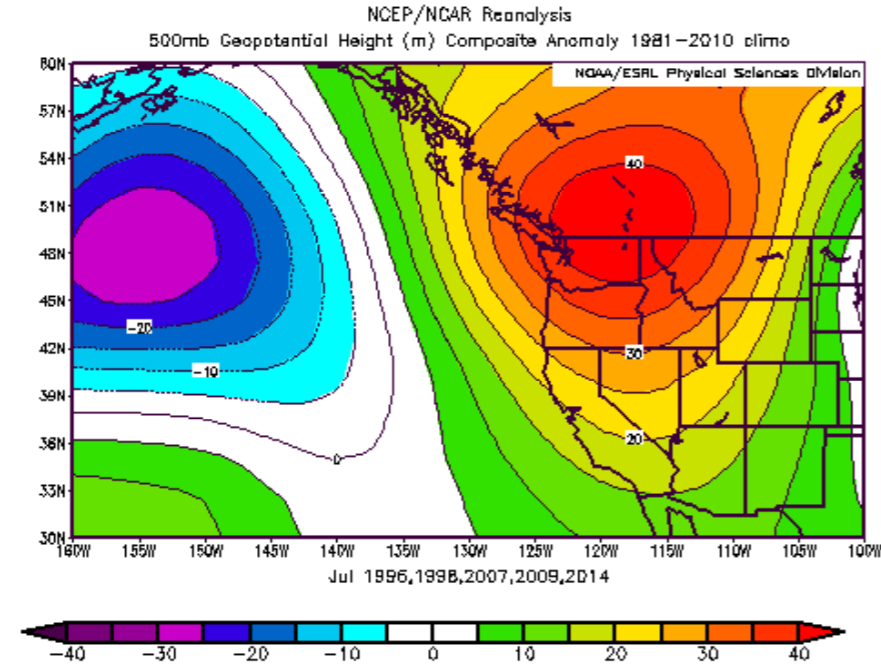
Can this discrepancy be attributed to a different regional circulation associated with dry months versus hot months in WA during the summer? As a means of pursuing this idea, we have created composite 500 hPa geopotential height anomaly maps for two sets of July months for the recent period of 1980-2015. These composites are for the 5 warmest July months that were not among the 10 driest July months, and for the 5 driest July months that were not among the 10 warmest months. In other words, we have excluded the months that are both extremely dry and warm to highlight the differences in the circulation for the two kinds of weather. The composite maps for the dry July months and warm July months are shown in Figures 1 and 2, respectively. Both composites feature above normal geopotential heights over WA, as expected. There are subtle differences, however. The dry, but not extremely warm, months have the center of the weaker positive anomalies to the west of the coastline, resulting in anomalous flow from the northwest which would serve to suppress the transport of moisture out of the southwestern US into WA state. On the other hand, its counterpart for the especially warm, but not dry, months includes a pattern with greater amplitude, and the high centered farther east. It is possible that this configuration may allow occasional periods of flow from the southeast and the rainfall that sometimes occurs in those situations. The present analysis is of the quick and dirty type, and while the results seem plausible, that does not mean that they are robust. They do suggest that rather subtle features in regional atmospheric circulation patterns can impact our rainfall during this dry time of the year.