The "Storm King" Windstorm of December 21, 2015

compiled by

Wolf Read and Charlie Phillips


1.0 Introduction


1.1 Background

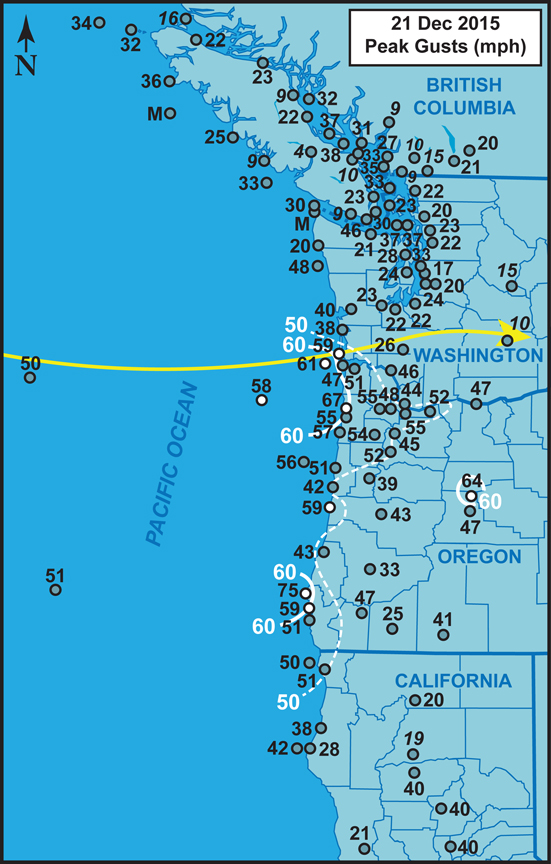
Figure 1.1 above Peak gusts (mph and km/h) for the December 21, 2015 windstorm. Wind speeds are largely from long-term surface airways weather observation sites, data buoys, lighthouses and C-MAN stations, with limited data from other networks (e.g. RAWS). Stations with long histories are preferred because of the research focus on intercomparison of historic storms. Numbers preceded by a tilde (~) represent the highest gust report in a dataset that has been interrupted at the height of the storm--usually data loss is from power outages. Values in italics are gusts estimated from peak wind, usually 2-minute or 5-minute, using a 1.3 gust factor. Stations with high-wind criteria gusts (≥58 mph or 93 km/h) are denoted with white-filled circles. Isotachs depicting ≥60 mph (~100 km/h) gusts are included to highlight the regions that had concentrations of the indicated magnitudes, with a 50 mph (80 km/h) line included to provide a better sense of the storm's wind distribution pattern. The track of the extratropical cyclone center is shown (yellow arrow). Click on the map to see a larger version. Here is a map listing the station names.


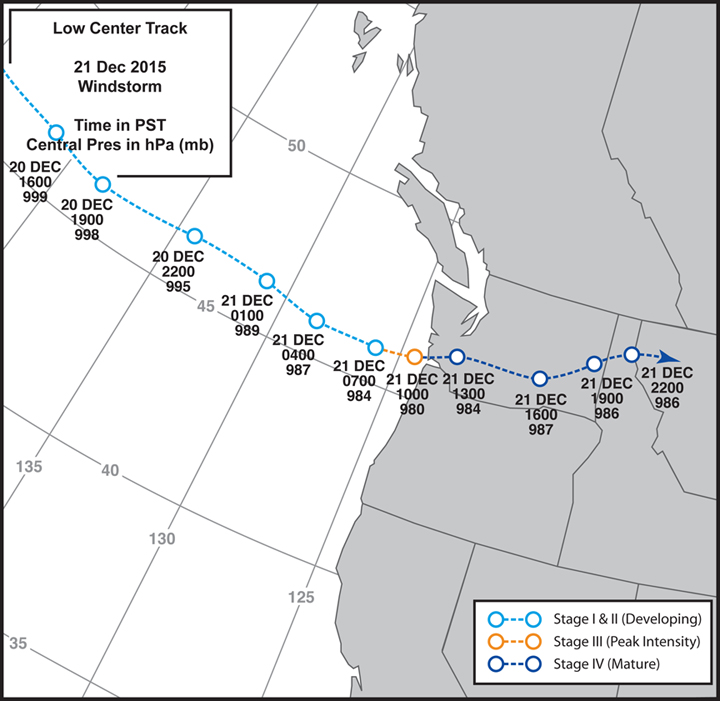
A classic west-jet extratropical cyclone, the December 21, 2015 windstorm tracked across the northeast Pacific almost without an deviation from a nearly due east path until landfall in the vicinity of Long Beach, Washington (Figure 1.1). Also in classic fashion for this track type, referred to here as the "Storm King" path, the highest winds were focused on the immediate south side of the low-pressure center. Sheltered stations along the Oregon coast received wind gusts of 45 to 60 mph (70 to 95 km/h), with exposed sites reporting speeds of 60 to 75 mph (95 to 120 km/h). This is in sharp contrast to much of the Washington coast where peak gust speeds at the more sheltered locations were generally in the range of 20 to 40 mph (30 to 65 km/h), with some exposed locations reporting gusts approaching 50 mph (80 km/h).

For the interior sections, the strongest winds were focused on the Willamette Valley, where peak gusts ranged from 40 to 55 mph (65 to 90 km/h), with the highest speeds being concentrated in the vicinity of Portland. In southwest Oregon, interior gusts climbed relatively high for the narrow, often wind-sheltered valleys, roughly 25 to 35 mph (40 to 55 km/h), marking a fairly vigorous frontal passage. The Washington and British Columbia interior generally received gusts of 20 to 25 mph (30 to 40 km/h), save for the extreme southern section where Kelso and Vancouver reported gusts around 45 mph (72 km/h). Over the interior waterways, gusts tended to be 30 to 45 mph (50 to 70 km/h).

The peaks at most stations at the north end of the Willamette Valley were associated with the passage of a strong and well-defined bent-back front, and had a somewhat unusual SW to WSW direction. Areas typically sheltered during more common southerly windstorms were in some cases more directly hit by the December 21, 2015 event, toppling vulnerable trees and catching some people by surprise. A near-surface wind direction counter to the mean orientation of the terrain (south to north) likely reduced the peak wind speed potential.

West-jet storms with a similar track include January 7-8, 1990 and January 11, 1988. These earlier extratropical cyclones produced higher interior wind gusts than the December 21, 2015 windstorm, with speeds reaching and exceeding 60 mph (95 km/h). Indeed, the 2015 storm ended up being a marginal high-wind event on official anemometers, with gusts topping out at 55 mph (90 km/h). This is below the official 58 mph (93 km/h) minimum for high wind gusts, but is right at the cutoff used here on The Storm King for windstorm climatological studies. When considering gust speeds of 50 mph (80 km/h) or more, the spatial distribution is quite similar to other Storm King events from history. In this regard, the storm had the outcome for its track class.


2.0 Synoptic Analysis


2.1 Storm Track


Figure 2.1 above Storm track estimation largely based on surface maps provided by the US. NOAA Weather Prediction Center, and satellite photo interpretation. Faded blue track follows a secondary low-pressure center that followed very close to the primary low. Date and time in PST and central pressure in hPa (mb).


The December 21, 2015 windstorm developed over the open Pacific Ocean far to the west and tracked nearly due east (Figure 2.1), carried on a strong jet stream. The system entered a rapid deepening phase just outside of 135ºW, and the intensification continued for the next 15 h, with the central pressure falling a solid 18 hPa (0.53" Hg) to 980 hPa (28.94" Hg) by 1000 PDT on December 21st. The central pressure began to rise just before landfall, climbing to an estimated 982 hPa (29.00" Hg) by the time the storm center moved over Long Beach, Washington, this estimate being based on a cyclostrophic wind model. Landfall occurred with the storm at near peak intensity. Filling continued as the low progressed inland, with the central pressure climbing to 984 hPa (29.06" Hg) as the low tracked due north of Portland, Oregon. The low continued weakening as it moved inland, and lost much definition as it crossed the rugged Cascades.

While over the open ocean, the extratropical cyclone moved quickly, approaching 60 mph (95 km/h) for a time. As the low neared landfall, its forward motion slowed dramatically, in classic fashion. The storm moved ashore with a speed around 25 mph (40 km/h) and continued at this rate across southwest Washington and into the Cascades. This had the effect of prolonging the period of strong pressure gradient over northwest Oregon and provided time for near-surface winds to accelerate to the gradient's potential.


2.2 Synoptic Charts


Figure 2.2 above Synoptic chart for 1200 UTC December 21, 2015 (0400 PST December 21, 2015). Orange shading depicts the 300 hPa jet stream, with brown italicized numbers labeling isotachs in m/s. Some radiosonde wind observations are included (in black) mainly to show conditions in the study region (2.5 m/s per half barb and 25 m/s per pennant). For the 500 hPa level black lines denote heights in dm. Upper lows and central heights are also marked in black. Isotherms in ºC are indicated with white dashed lines. Surface lows and central pressures in hPa are indicated with dark blue, with tracks in light blue. Key surface anticyclones are indicated in red.


The December 21, 2015 extratropical cyclone developed under the left-exit region of a strong 300 hPa jet stream maximum (Figure 2.2). The jet stream had a strongly zonal configuration, with a west to west-northwest airflow. The surface low also developed in the base of a broad and shallow 500 hPa trough, quite typical for a "west-jet" scenario, with the low tracking nearly due east. Deeper, more U-shaped troughs tend to support storm tracks with a northeast to north direction. An example of a more pronounced trough is included in the analysis for the December 11, 2014 classic windstorm. For the December 21, 2015 storm, there is clear warm advection ahead of the system, but cold advection wrapping around the base of the low appears to have been fairly weak.


2.3 Satellite Photos


Figure 2.3 above Satellite photo composite of: a) four km resolution visible; b) four km water vapor; c) four km enhanced infrared; and d) one km visible images. Times are 1600 UTC (0800 PST) on December 21, 2015, save for (d) which is 1945 UTC (1145 PST), or near the time of landfall.


Satellite imagery reveals the strong jet stream racing to the east-southeast that supported the formation of the December 21, 2015 extratropical cyclone (Figure 2.3), as described in section 2.2. A clearly defined dry slot suggests strong development of the low (dark gray and orange), located just off of Astoria at the time of the 4-km resolution photos. The system had a well-defined bent-back front, the tip of which swept right into northwest Oregon, seen wrapping around the low in the 1-km visible image.


3.0 Storm Data


3.1 Surface Pressure Observations

Table 3.1 below Minimum sea-level pressure for 26 stations in the study region, with timing and averages. The 11-station average uses ACV, OTH, AST, UIL, MFR, EUG, SLE, PDX, OLM, SEA and BLI.


Station Station Latitude (ºN) LoPres (" Hg) LoPres (hPa) Hour (PST) Day (PST)

Coast
KACV 40.98 29.60 1002.3 0200 22
KCEC 41.78 29.64 1003.6 0200 22
KOTH 43.42 29.49 998.6 0800 21
KONP 44.61 29.30 992.2 0800 21
KAST 46.16 29.03 982.9 1200 21
KHQM 46.97 29.10 985.3 1100 21
KUIL 47.94 29.20 988.9 1000 21
46087 48.50 29.25 990.5 0900 21
CWEB 49.38 29.34 993.5 0900 21
CWRU 50.12 29.34 993.7 0800 21
Interior
KRBL 40.15 29.61 1002.7 0500 22
KMHS 41.32 29.66 1004.3 0400 22
KMFR 42.38 29.61 1002.7 1100 21
KRBG 43.23 29.51 999.4 0900 21
KEUG 44.13 29.39 995.1 0800 21
KSLE 44.91 29.26 991.0 0900 21
KPDX 45.60 29.19 988.4 1300 21
KOLM 46.97 29.10 985.3 1200 21
KSEA 47.44 29.15 987.0 1300 21
KNUW 48.35 29.25 990.5 1300 21
KBLI 48.64 29.24 990.3 1400 21
CYYJ 48.80 29.26 990.9 1400 21
CYVR 49.03 29.25 990.4 1400 21
CYXX 49.18 29.23 990.0 1400 21
CYQQ 49.72 29.34 993.4 1400 21
CYZT 50.68 29.36 994.2 1400 21
     
Average 29.33 993.4
Coast Avg 29.33 993.2
Interior Avg 29.34 993.5
11-Sta Avg 29.30 992.0    


As is typical for a west-jet storm, only a few stations received the most extreme pressure minima--those stations close to the track of the low-pressure center (Table 3.1). Astoria, very close to the landfall location of the center, reported the lowest pressure among the listed coastal stations. The low took an east-northeast jog during its trek across sourthwest Washington and passed fairly close to Olympia, thus bringing the lowest pressure to this inland station. Not shown in the table, Chehalis reported a minimum altimeter reading of 29.06" Hg (984.1 hPa) at 1235 PDT. The exact center appears to have tracked just south of this station, and north of Kelso.


Figure 3.1 above Coastal sea-level pressure trends (hPa) during the December 21, 2015 windstorm. Southern stations are shaded in orange, with northern in blue.


Figure 3.2 above Coastal sea-level pressure trends (hPa) during the December 21, 2015 windstorm. Southern stations are shaded in orange, with northern in blue.


As the December 21, 2015 storm moved east to east-northeast on its inland route over southwest Washington, barometers well to the south and north barely felt the compact system (Figures 3.1 and 3.2). The pattern of sea-level pressure readings on the coast is simply classic for this kind of storm. Astoria shows an inverted shark-fin form--this is the mark of the passage of the strong low just to the north, followed by the arrival of the bent-back front and its associated extreme pressure rises, sometimes called a pressure surge.


Figure 3.3 above Three-dimensional display of coastal sea-level pressure trends (hPa) during the December 21, 2015 windstorm. Southern stations are shaded in orange, with northern in blue.


An important feature in both of the above charts is the tendency for higher pressure to reside to the south of incoming extratropical cyclones (Figure 3.3). The pressure over northern California remained far higher than over northern Vancouver Island as the extratropical cyclone moved inland. A mature 982 hPa (29.00" Hg) low resided over the coastal waters northwest of Haida Gwaii, with a long trough extending to the December 21, 2015 storm. This, too, is a classic pattern for Northwest windstorms, with a key result being a tendency for lower pressure gradients to the north of the low. This helps prevent intense northerly winds--north of the storm track--during many Cascadia windstorms.


Figure 3.4 above Coastal sea-level pressure cross-sections (hPa) during the December 21, 2015 windstorm. Stations are arranged by latitude. Earlier times (PST) have lighter shades. Times are in PST.


Figure 3.5 above Interior sea-level pressure cross-sections (hPa) during the December 21, 2015 windstorm. Stations are arranged by latitude. Earlier times (PST) have lighter shades. The blue dashed lines denotes the estimated surface pressure and position of the low-pressure center at 1300 PST.


South-to-north cross sections of sea-level pressure reveal a well-developed extratropical cyclone at landfall around noon on December 21, 2015 (Figure 3.4). There is evidence of a funnel-shaped profile, especially on the south side of the low, an indication of a strong system near peak intensity. As the low tracked inland, encountering the frictional effects of the rugged terrain, the pressure gradients relaxed rather quickly (Figure 3.5). The cross-section at 1300 indicates a trend to a more bowl-like form. This likely mitigated the potential for high winds at inland locations, including the Willamette Valley. The low center tracked between Kelso and Chehalis, with the result being strong S winds at the former and light N winds at the latter. The central pressur at this time was around 984 hPa (29.06" Hg).


3.2 Surface Pressure Tendencies

Table 3.2 below Maximum one hour pressure tendencies (hPa/hr) for 26 stations in the study region. Separation is the number of hours between the maximum rate of fall and maximum rate of rise.


Station Max Hourly Fall (hPa) Hour (PST) Day (PST) Max Hourly Rise (hPa) Time (PST) Day (PST) Sepa-ration (hr)

Coast
KACV -2.3 0500 21 1.3 0900 20 28
KCEC -2.6 0400 21 1.3 0800 20 4
KOTH -3.7 0400 21 1.4 0900 20 5
KONP -3.9 0500 21 2.0 1100 21 6
KAST -4.2 0600 21 5.8 1300 21 7
KHQM -3.6 0700 21 2.4 1300 21 6
KUIL -2.7 0700 21 1.5 1400 21 7
46087 -2.5 0700 21 0.9 1600 21 9
CWEB -1.5 0100 21 0.7 1600 21 15
CWRU -1.2 2300 20 0.8 1600 21 17
Interior
KRBL -1.6 2300 21 1.0 1000 22 11
KMHS -1.5 1300 21 1.0 1600 21 3
KMFR -2.4 0500 21 1.0 1600 21 11
KRBG -2.6 0500 21 1.1 1000 21 5
KEUG -3.2 0400 21 1.8 1100 21 7
KSLE -3.9 0500 21 2.0 1500 21 10
KPDX -3.6 0600 21 3.6 1500 21 9
KOLM -3.2 0700 21 3.2 1500 21 8
KSEA -3.1 0800 21 3.1 1600 21 8
KNUW -2.2 0800 21 1.5 1600 21 8
KBLI -2.3 0800 21 1.2 1500 21 7
CYYJ -1.9 0700 21 1.0 1600 21 9
CYVR -2.1 0800 21 1.0 1800 21 10
CYXX -2.0 0700 21 1.1 1800 21 11
CYQQ -1.4 0500 21 0.6 0000 22 19
CYZT -1.1 0600 21 0.8 1600 21 10
     
Average -2.6 1.7
Coast Avg -2.8 1.8
Interior Avg -2.4 1.6
11-Sta Avg -3.1 2.4


As the surface pressure trends in section 3.1 indicate, the strongest pressure tendencies occurred from Newport to Hoquiam on the coast, with Astoria right at the center of the action, and Portland to Olympia in the interior (Table 3.2). The readings at Astoria indicate a vigorous storm. However, they are well below the tendencies of a number of major landfalling windstorm events, including -7.7 hPa/hr and +16.6 hPa/hr at North Bend during the November 10, 1975 storm and -7.1 hPa/hr and +13.9 hPa/hr at Hoquiam on November 3, 1958. These earlier windstorms brought much higher peak wind and gust speeds to their respective strike zones than the December 21, 2015 event.


Figure 3.6 above Hourly pressure tendencies (hPa/hr) at coastal stations for the December 21, 2015 windstorm. Southern stations are shaded in orange, with northern in blue.


Figure 3.7 above Hourly pressure tendencies (hPa/hr) at interior stations for the December 21, 2015 windstorm. Southern stations are shaded in orange, with northern in blue.


The coincidence of pressure tendency extremes at stations near the landfall point of the storm center (Figures 3.6 and 3.7) is classic for a west-jet storm. This is, of course, due to the geometry of the situation, with the stations lined approximately south to north up to Buoy 46087 and the low tracking inland perpendicular to the line of observation sites. Earlier peaks at the southern stations, such as Eugene, are likely the result of the leading front arriving ahead of the low.


3.3 Standard (1-Dimensional) Pressure Gradients

Table 3.3 below For a selection of the many possible station pair combinations in the study region, standard (or one-dimensional) pressure gradients. Station-pair latitude (º), distance (km) and bearing (º) are provided. The raw peak gradient magnitude in hPa is shown along with the same value scaled to hPa/100 km. Scaling the gradients to a standard measure provides more consistent intercomparison between regions. Times and dates are in PST.


Station Pair Midpoint Latitude (º) Distance (km) Bearing N-S or W-E (º) Max Pressure Gradient (hPa) Max Pressure Gradient (hPa/100 km) Time (PST) Day (PST)

South-North
Coast (Short)
ACV-CEC 41.38 89.8 173 5.0 5.6 0600 21
CEC-OTH 42.60 182.0 180 8.3 4.6 0800 21
OTH-NWP 44.01 133.5 186 6.8 5.1 0900 21
NWP-AST 45.38 172.6 185 15.2 8.8 1200 21
AST-HQM 46.56 90.6 179 -3.6 -4.0 1200 21
HQM-UIL 47.45 117.6 156 -3.9 -3.3 1100 21
UIL-46087 48.22 63.5 170 -1.8 -2.8 1000 21
46087-WEB 48.94 167.0 127 -3.1 -1.9 1100 21
WEB-WRU 49.75 128.6 130 1.2 0.9 0200 22
Coast (Medium)
ACV-OTH 42.20 271.4 177 11.8 4.3 0600 21
OTH-AST 44.79 306.1 185 20.5 6.7 1200 21
AST-UIL 47.05 204.4 166 -6.5 -3.2 1200 21
UIL-WEB 48.66 217.5 138 -4.7 -2.2 1100 21
Coast (Long)
ACV-AST 43.57 576.2 182 28.2 4.9 1200 21
AST-WEB 45.18 410.4 152 -11.0 -2.7 1200 21
ACV-HQM 43.97 666.6 181 25.8 3.9 1100 21
HQM-WRU 48.54 457.7 141 -8.7 -1.9 1100 21
OTH-UIL 45.68 503.3 177 14.0 2.8 1200 21
ACV-UIL 44.46 774.7 178 21.9 2.8 1100 21
Interior (Short)
RBL-MHS 40.73 129.7 178 1.8 1.4 0300 21
MHS-MFR 41.85 127.1 159 9.8 7.7 0700 21
MFR-RBG 42.81 102.7 158 4.1 4.0 0900 21
RBG-EUG 43.68 100.7 186 5.1 5.1 0800 21
EUG-SLE 44.52 87.9 191 4.6 5.2 1100 21
SLE-PDX 45.25 82.3 201 6.7 8.1 1300 21
PDX-OLM 46.28 154.8 172 3.2 2.1 1200 21
OLM-SEA 47.21 68.8 220 -2.6 -3.8 0700 21
SEA-NUW 47.90 103.7 166 -3.5 -3.4 1100 21
NUW-BLI 48.50 50.7 189 1.3 2.6 1700 21
BLI-YVR 48.84 62.5 133 1.3 2.1 1800 21
YVR-YQQ 49.38 138.6 116 -3.0 -2.2 1400 21
YQQ-YZT 50.20 205.8 122 1.7 0.8 0600 21
Interior (Medium)
RBL-MFR 41.27 253.4 168 11.2 4.4 0700 21
MFR-EUG 43.26 196.8 172 9.2 4.7 0800 21
EUG-PDX 44.41 169.5 196 10.2 6.0 1300 21
PDX-SEA 46.52 206.8 186 4.6 2.2 1500 21
SEA-BLI 48.04 151.5 174 -3.8 -2.5 1200 21
BLI-YQQ 49.18 199.3 122 -3.3 -1.7 1300 21
Interior (Long)
RBL-EUG 42.14 449.9 170 18.9 4.2 0800 21
EUG-OLM 45.55 316.7 184 12.8 4.0 1200 21
OLM-BLI 47.81 204.8 187 -5.9 -2.9 1200 21
BLI-YZT 49.66 405.0 123 -3.9 -1.0 1400 21
West-East
ACV-RBL 40.56 181.8 120 -5.5 -3.0 0700 21
OTH-RBG 43.33 75.1 105 -2.8 -3.7 0500 21
NWP-SLE 44.76 91.1 68 4.3 4.7 1200 21
AST-DLS 45.89 218.5 105 -10.7 -4.9 0800 21
PDX-DLS 45.61 112.2 88 6.1 5.4 1500 21
HQM-OLM 46.97 77.1 89 -3.4 -4.4 0800 21
UIL-BLI 48.29 177.0 56 -6.4 -3.6 0700 21
BLI-YHE 49.00 99.6 50 -2.3 -2.3 0900 21
YVR-YHE 49.20 123.8 80 -2.9 -2.3 0900 21
WEB-YQQ 49.55 124.7 72 -2.4 -1.9 0400 21


The standard (1-dimensional) pressure gradients for the December 21, 2015 windstorm were moderate in general, with the strong values occurring very close to the storm center on the south side (Table 3.3). A number of extratropical cyclones from history have brought more extreme values than the +10.2 hPa for the EUG-PDX measure. This includes "Storm King" type events on February 5, 1965, October 2, 1967 and January 7-8, 1990. These three historic storms produced higher wind gusts in the Willamette Valley than the December 21, 2015 windstorm, including 78 mph (130 km/h) at Portland in 1967. The lower pressure gradients associated with the December 21, 2015 extratropical cyclone is likely the most significant reason that winds were not stronger in the Willamette Valley.


Figure 3.8 above Coastal scaled pressure gradients (hPa/100 km) for medium-distance station separations. Southern station pairs are shaded in orange, with northern in blue. Times are PST.


Figure 3.9 above Interior scaled pressure gradients (hPa/100 km) for medium-distance station separations. Southern station pairs are shaded in orange, with northern in blue. Times are PST.


Time series plots of the coastal pressure gradients reveal a classic positive and negative shark-fin pattern (Figure 3.8). This is the mark of a strong low-pressure center tracking right between key station pairs, OTH-AST and AST-UIL, allowing for a near-perfect signal. For a strikingly different pattern, compare these charts to the results of the December 11, 2014 windstorm that tracked north-northeast up the coast.

As is typical, the signal is softened at interior stations (Figure 3.9), the mark of weakening pressure gradients. However, some of the less-sharp signal has to do with the low center tracking right through the middle of the PDX-SEA measure, a fact that would prevent a very strong gradient from being captured. A finer resolution would probably capture more detail over the southwest Washington interior.


Figure 3.10 above Intercomparison of coastal and interior scaled pressure gradients (hPa/100 km) for medium-distance station separations, with locations arranged by latitude. Depicted are the peak absolute values, therefore negative gradients are shown as positive (not to be confused with the absolute, or 2-D, pressure gradients discussed in section 3.4 below). The coast is shown in black, interior gray.


Figure 3.11 above Intercomparison of coastal and interior scaled pressure gradients (hPa/100 km) for short-distance station separations, with locations arranged by latitude. Depicted are the peak absolute values, therefore negative gradients are shown as positive (not to be confused with the absolute, or 2-D, pressure gradients discussed in section 3.4 below). The coast is shown in black, interior gray.


Maximum standard pressure gradients show the classic pattern of higher values south of the low-pressure center (Figures 3.10). North of the low, peak pressure gradients fall off sharply near the low center, then then continue downward more gradually, reaching quite modest levels. The short measures capture the pattern quite strongly (Figure 3.11). Note that the interior value at 42ºN, MHS-MFR, is in question. The station MHS is at quite a high elevation, 3,540 feet (1,079 m). There are known issues with reducing pressure to sea level from high-elevation stations, and the error is likely showing up in the steep MHS-MFR pressure gradient. RBL-MHS would also be affected by the error, in the opposite direction, meaning the reported value is probably too low.


3.4 Absolute (2-Dimensional) Pressure Gradients

Table 3.4 below For 17 pressure-wind triangles located in the study region, peak absolute (2-D) pressure gradients (hPa/100 km), associated pressure slope (º), geostrophic potential wind (Mg in mph) and estimated peak surface wind and gust (mph) for overland regions based on the gradient magnitude and the presence of turbulent drag from surface roughness. Sea level pressure data for WSP is missing, preventing computation of pressure gradients for the north Washington coast.


Location Station Triad Mean Lati-tude (ºN) Max Pres Grad  (hPa / 100 km) Pres Slope (º) Peak Mg (mph) Est Peak  2-Min Wind (mph) Est Peak  3-Sec Gust (mph) Time (PST) Day (PST) Mo (PST)

Coast
Northwest California UKI-RBL-CEC 40.35 4.4 121 85 30 50 0600 21 12
South Oregon CEC-OTH-RBG 42.81 5.0 147 93 30 50 0500 21 12
North Oregon OTH-AST-PDX 45.05 7.0 169 123 35 55 1200 21 12
South Washington AST-HQM-OLM 46.70 4.8 66 83 25 45 0800 21 12
North Washington HQM-46087-WSP 47.95
South Vancouver Island TTI-WEB-YQQ 49.20 4.0 6 67 25 45 0800 21 12
Central Vancouver Island WEB-WRU-YZT 50.06 4.2 86 69 25 45 0000 21 12
North Vancouver Island WRU-46207-YZT 50.56 3.1 78 50 20 35 2100 20 12
Interior
Northwest California RBL-LMT-MFR 41.56 4.7 213 88 30 50 1300 21 12
Southwest Oregon MFR-EUG-BDN 43.54 5.4 142 99 30 50 0800 21 12
Northwest Oregon EUG-PDX-AST 45.30 6.6 165 116 30 50 1200 21 12
Willamette Valley EUG-HIO-TTD 45.08 7.0 138 124 35 55 1000 21 12
Southwest Washington PDX-OLM-TCM 46.57 3.8 113 65 25 45 1200 21 12
Puget Lowlands TCM-PAE-CLM 47.73 4.1 251 69 25 45 1500 21 12
Northwest Washington PAE-CLM-YVR 48.41 3.9 269 65 25 45 1400 21 12
Puget Trough OLM-YVR-YHE 48.51 2.7 51 45 20 35 0900 21 12
South Georgia Strait YYJ-YVR-YXX 48.95 2.6 30 44 20 35 0700 21 12
Georgia Strait YYJ-YQQ-WSK 49.38 2.2 45 36 15 25 0700 21 12


Maximum absolute (2-dimensional) pressure gradients tell a story similar to the standard 1-dimensional gradients in section 3.3 (Table 3.4). The highest gradients occurred on the immediate south side of the low, with more modest maxima to the north. Pressure gradient orientations (pressure slope) are interesting. Often with landfalling storms of this nature, the maximum gradients--in those regions immediately to the south of the storm center--tend to have a south-southwest to southwest orientation. In the case of the December 21, 2015 windstorm, the gradient had a southeasterly orientation at peak. This suggests that peak gradient occurred ahead of the low, probably near the time of landfall, instead of when the low tracked due north of places such as the Willamette Valley in what would be a more classic response. The difference in pressure slope may have mitigated peak gust speeds to some extent. Nevertheless, pressure gradient maxima agree quite well with the observed near-surface wind response, as indicated by the estimated peak wind and gust for different regions. The December 21, 2015 extratropical cyclone only provided a modest "taste" of what a Storm King type event can deliver.


Figure 3.12 above Absolute (2-D) pressure gradients (hPa/100 km) for coastal regions. Trendlines from southern pressure-wind triangles are shaded in orange, with northern in blue.


Figure 3.13 above Absolute (2-D) pressure gradients (hPa/100 km) for interior regions. Trendlines from southern pressure-wind triangles are shaded in orange, with northern in blue.


Figure 3.14 above Intercomparison of the peak absolute pressure (or 2-D) gradient (hPa/100 km) for coastal (black) and interior (gray) locations arranged by mean latitude.


Two regions were affected by strong pressure gradients approaching 7.5 hPa/100 km during the December 21, 2015 windstorm: the north Oregon Coast and Willamette Valley (Figures 3.12 and 3.13). Areas further south experienced moderately strong gradients of around 5.0 hPa/100 km. As is typical of this kind of event, regions north of the track tended to have the lowest pressure gradients. The area of peak gradient around the storm center does not stand out very strongly relative to the background, or surrounding regions (Figure 3.14). Compare this outcome to some other recent storms that produced much stronger differences in peak pressure gradient, such as December 11, 2014 and October 15, 2016. The somewhat muted profile and the given pressure gradient magnitudes fits well with wind speeds that in general did not quite reach official high wind criteria in most areas.


Figure 3.15 above Absolute (2-D) pressure gradient coastal cross-sections (hPa/100 km). Earlier times are represented by the warm colors, with later times the cool colors.


Figure 3.16 above Absolute (2-D) pressure gradient interior cross-sections (hPa/100 km). Earlier times are represented by the warm colors, with later times the cool colors.


Pressure gradient profiles reveal a trend of pressure gradients relaxing to the north and south of the storm track as the December 21, 2015 windstorm neared the coast (Figure 3.15). At the same time, gradients near the track escalated. For southern sections, pressure gradients were at their strongest in the warm sector during the early morning, with the low still offshore. At the same time, northern regions were under a relatively strong easterly gradient in the storm's northeast quadrant. As the low tracked inland around noon, pressure gradients to the south relaxed after the cold front swept through. To the north, gradients also relaxed as the long trough stretching from a mature Gulf of Alaska low moved inland with the December 21, 2015 extratropical cyclone, depressing barometric readings over a large area. Strong gradients only resided near the low-pressure center, reflecting a compact core.

While pressure gradients escalated gradually on the coast, the interior sections experienced a more sudden onset with a sharp jump between 0800 and 1000 PST (Figure 3.16). It appears that pressure gradients climbed rapidly after the leading warm front swept through the Willamette Valley, with temperatures escalating from roughly 5ºC (40ºF) to 10ºC (50ºF). The pressure slope also shifted from easterly to southeasterly. With the cold surface layer scoured out by invading warm air, and the pressure slope orientation becoming better aligned, the warm front opened the gates for strong south winds. Over the next three hours, the southerly winds shifted to southwest and escalated to peak values as the bent-back front neared, this despite a slight relaxation of the pressure gradient over the Valley as a whole. What appears to have happened is that the pressure gradient over the north half of the Valley intensified as the low center neared while over the south Valley the gradient may have already begun diminishing, with the effect being a slight decrease in the overall measure. This is reflected in the 1-D pressure gradient short measures (Table 3.3), with a much sharper peak for SLE-PDX, 6.7 hPa/100 km at 1300 PST, compared to EUG-SLE, 4.6 hPa/100 km at 1100 PST. The difference from south to north across the Valley at 1300 PST can also be seen in Figure 3.5. The numbers provide another reflection of a storm with a very compact core and an approximate funnel-shaped pressure profile.


Data Sources and Bibliography


Data Sources

Surface observations are from the National Climatic Data Center, the National Data Buoy Center, Environment Canada and the University of Washington. Surface maps used for storm track determination are from the US. Weather Prediction Center. Upper-air analysis is based on maps from the US. National Center for Environmental Prediction. Satellite photos are from the US. National Weather Service. Upper-air sounding data are from the University of Wyoming Department of Atmospheric Science.

Last Modified: November 25, 2016
Page Created: November 4, 2016

| Back |