The February 5, 1965
Windstorm: compiled by Wolf Read |
|
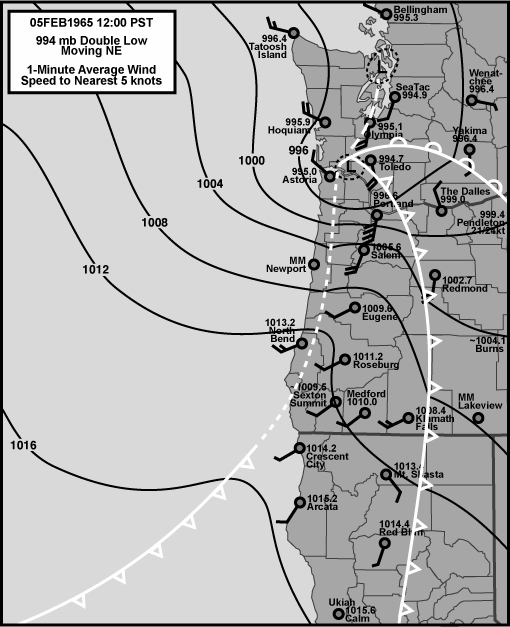
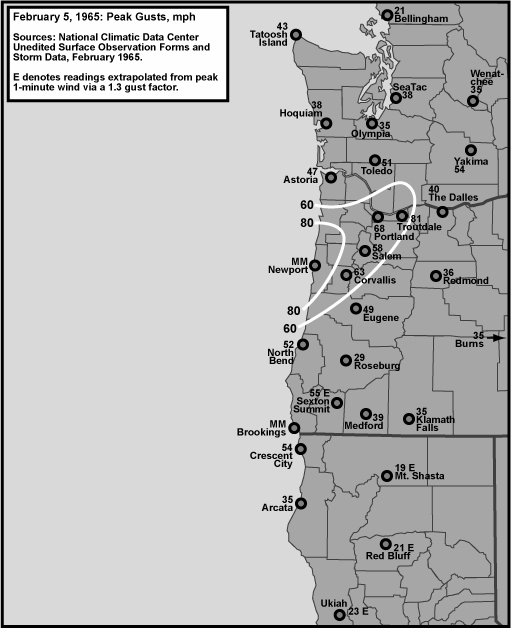
Around high noon on February 5, 1965, a double low moved northeast across Western Washington and set up an extraordinary atmospheric pressure gradient across the Willamette Valley. As the gradient rapidly escalated, high winds tore through much of Northwest Oregon, with Coast Guard instruments showing gusts above100 mph along the Pacific shore, according to the National Climatic Data Center's Storm Data Publication for February 1965. Gusts of 60 to 70 mph tore through much of the Willamette Valley, and even topped 80 at Troutdale. This storm was a particularly damaging one. According to the same Storm Data publication: "Hundreds of trees blown down, many across power lines, some on cars and buildings, and many across highways causing the temporary closing of many roads. Large numbers of outdoor signs, roofs, and windows badly damaged or destroyed." This damage description sounds very similar to the results of the extraordinary windstorm of February 7, 2002. Both systems had central pressure just below 995 mb upon landfall (993 mb in 1965 and 994 mb in 2002), and both concentrated their highest winds in a fairly narrow belt that extended from a SW to NE direction across a portion of the coast and Willamette Valley. The main difference between the two storms is that February 5, 1965 struck the north half of the valley, and February 7, 2002 struck the south half. Also, the February 7, 2002 cyclone was better defined and didn't have the double low structure of the February 5, 1965 event. In some ways, the February 5, 1965 storm was more like an intense open wave than a true cyclone, though evidence of some cyclonic circulation does exist. The track of the February 5, 1965 storm puts it in the "storm king" category. Two other important storm king events happened right during the era of the '65 storm: March 27, 1963 and October 2, 1967. The approximately two year return of this kind of event, and each one striking with wicked intensity, during the mid-1960s is an interesting occurrence. It may simply be coincidence, or a reflection of a particular phase among the different known climate cycles such as the Pacific Decadal Oscillation (PDO). A two-year return is also suggestive of the well-known Quasi-Biennial Oscillation (QBO), but the problem with this assessment is that cyclones are such transient phenomena (essentially noise in the climatological background) that it may be impossible to pin down a direct link. The February 5, 1965 cyclone produced one of the most extreme Eugene-to-Portland (EUG-PDX) pressure gradients for the period 1948-present. At +13.0 mb (+0.38"), the peak gradient puts the event in a rarefied category of storms. Of the events examined in detail on this website, only two events have generated EUG-PDX gradients higher than this: the major windstorm of December 4, 1951 set up an extraordinary gradient of +15.2 mb (+0.45") across the length of the Willamette Valley, and the abovementioned October 7, 1967 windstorm produced a peak EUG-PDX gradient of +13.7 mb (+0.40"). According to available data, two instances of +13.0 mb or higher EUG-PDX gradients within just 2.5 years is evidently a rare happenstance (1965 & 1967). With such a gradient, we witness the mechanism for the powerful gale that hit the Northwest. The swath of high winds (50-knot-plus, or 58 mph) from the February 5, 1965 windstorm appears to have been roughly 150 miles wide on the coast, narrowing to about 50-75 miles inland. This band persisted, though in weakened form, as the storm crossed the Cascades. Gusts reached 54 mph at Yakima, close to high-wind criteria. Much of the Columbia Basin was also battered, with both Pendleton and Spokane reporting peak gusts of 58 mph, reflecting a typical widening (likely due to favorable terrain) of the high-wind field as the storm continued northeast. |
February 5, 1965: Some Meteorological Details |
Figure 2, below, is a surface map for the time of peak gradient in the Willamette Valley. The multi-front structure is supported, in part, on official maps, making this storm appear somewhat like a pinwheel and, perhaps, a little unconventional (the Norwegian model is just that--a model; reality can be more complex). Evidence of cyclonic circulation around the southern low is in the NW winds at Astoria and Hoquiam, with SSE at Toledo and SSW in the Willamette Valley. The south winds at Olympia and Seattle are, perhaps, due to the second low east of the Olympic Mountains. Source: Hourly data are from the National Climatic Data Center, unedited surface observation forms. Official surface maps used in this interpretation are from the NOAA Central Library U.S. Daily Weather Maps Project. |
|
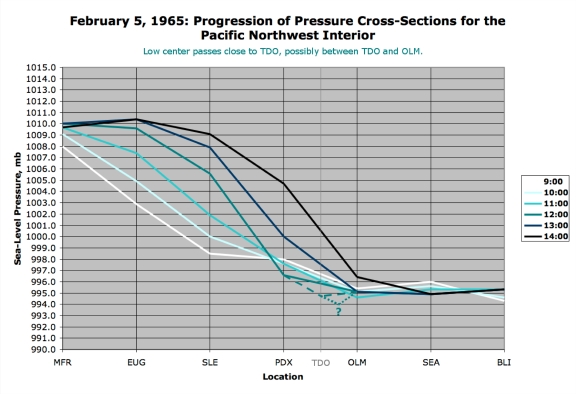
A south-to-north series of surface pressures provides a view of the progress of this storm, shown in Figure 3, below. The rapid magnification of the pressure gradient in the Willamette Valley is clearly shown, with the EUG-PDX value jumping from +5 mb (+0.15") at 09:00 PST to +13 mb (+0.38") by 12:00. Afterward, a strong pressure surge at Portland quickly reduces the gradient across the valley, while simultaneously strengthening the difference between PDX-OLM: the region of tightest gradient had shifted north with the entire storm system. The broad dashed line marks the TDO reading at 12:00, with a speculative low pressure center between TDO and OLM (short dashed line with question mark). Source: Hourly data are from the National Climatic Data Center, unedited surface observation forms. |
|
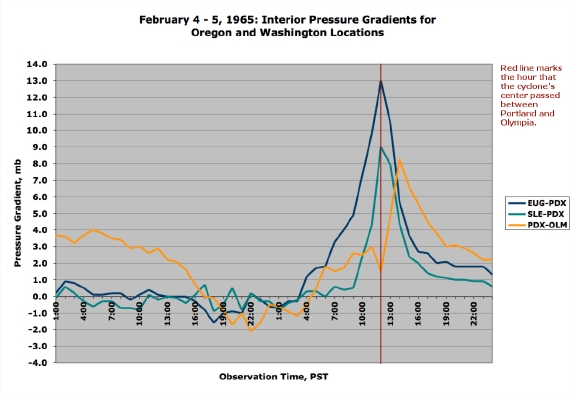
Figure 4, below is another way of showing the rapid pressure gradient escalation that occurred with this storm, with PDX-OLM peaking after EUG-PDX. This profile is very similar to the abovementioned February 7, 2002 windstorm, with gradients going from winter-typical to extreme in just a few hours, and then falling off rapidly. This was a fast-moving storm; often, the fast-movers are the most threatening wind-wise. Source: Hourly data are from the National Climatic Data Center, unedited surface observation forms. |
|
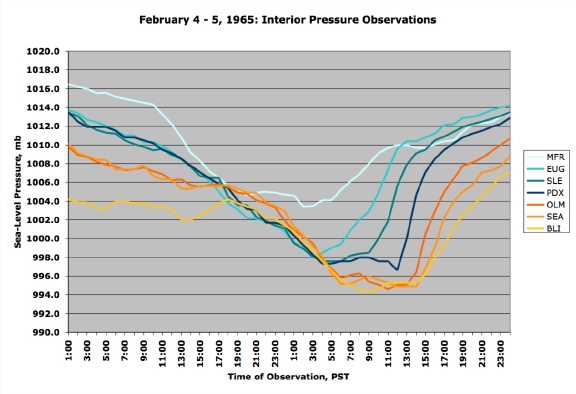
Figure 5, below shows the hourly sea-level pressure observations for interior stations during the February 5, 1965 storm. Portland clearly receives a barometric "kicker" right around noon, while the barometers at Salem and Eugene are on the climb. This brief pressure fall may be from the arrival of the storm's cold front, a event that happened earlier for the southern stations. Winds at Portland reached 22 mph G 40 by 07:56 PST, shortly after the storm's leading warm front kicked temperatures up to 56 F from a reading of 47 F at 05:58. By 08:34, winds had elevated to 35 mph G 54. These winds continued battering the Portland area for hours, reaching 40 mph G 68 by 10:45, and then continuing this range up to the 11:56 reading of 46 mph G 63 that occurred near the arrival of the front. The temperature had dropped to 45 F by this time, and would be down to 41 F by 13:56. Winds were still 40 mph G 52 at 12:57, but were clearly decreasing. At 13:56, they had lowered to a blustery 28 mph G 39. Gale force gusts persisted for six hours at Portland! This is quite unlike the February 7, 2002 windstorm, which had its damaging winds occur within the space of just one to two hours. The duration and intensity of wind marks a significant windstorm. Source: Hourly data are from the National Climatic Data Center, unedited surface observation forms. |
|
General Storm Data Table 1, below, lists the barometric minimums for the February 5, 1965 storm at selected sites. These pressures mark a fairly solid storm, but are far from the minimums recorded in many windstorms. Source: Hourly data are from the National Climatic Data Center, unedited surface observation forms. |
Table 1 Notes: [1] Last of five occurences, the others having happened from 17:00-20:00 on the 4th. [2] Last of two hourly reports in a row with the same reading. [3] Last of three hourly reports in a row with the same reading. [4] Last of three hourly reports in a row with the same reading. |
Table 2, below, lists the maximum gradients for some standard measures during the February 5, 1965 cyclone. The strong gradients on the coast nevertheless fall short of many windstorms in history. The big story is the steep gradient right over the Willamette Valley. As mentioned, the +13.0 mb (+0.38") EUG-PDX gradient is among the highest values for the period 1948-present, surpassed by only two storms described on this website. At the same hour, 12:00 PST, the SLE-PDX gradient was an incredible +9.0 mb (+0.27")! A reading of +9.0 mb for the longer EUG-PDX measure would be noteworthy, and an expected value for a big windstorm! The north Willamette Valley was clearly in "ground zero" during the February 5, 1965 cyclone. Source: Hourly data are from the National Climatic Data Center, unedited surface observation forms. |
Table 2 Notes: [1] Last of two hourly occurences in a row. [2] Max negative gradient -3.6 mb at 11:00 PST. |
Pressure Tendencies Table 3, below, shows the maximum hourly changes in pressure for eleven key stations in the Pacific Northwest. The February 5, 1965 windstorm had fairly timid pressure falls as the storm moved in, perhaps one of the weakest accountings for an event that has produced high-wind-criteria gusts in the Pacific Northwest. In contrast to the modestly falling pressures ahead of the cyclone, a strong pressure surge followed as the storm moved into the Cascades. This surge is especially evident across Northwest Oregon and Southwest Washington, and is more in line with the observed peak wind speeds. Source: Microfilm copies of unedited surface observation forms from the National Climatic Data Center. |
|
||||||||||||||||||||||||||||||||||||||||||||||||||||||||||||||||||||||||||||||||||||||||||
Table 3 Notes: [1] The -2.0 mb hourly fall at Arcata is the last of two occurrences, the other instance having occurred the hour before. [2] The +2.0 mb hourly rise at North Bend is the last of two occurrences, the other instance having happened in the hour before. [3] The +1.1 mb hourly rise at Medford is the last of three occurrences, the other instances having happened at 06:00 and 09:00 on the 5th. [4] The 1.2 mb hourly fall at Eugene is the last of two occurrences, the other instance having happened at 18:00 on the 4th. |
Table 4, below, lists the peak wind and gust for eleven key stations in the Pacific Northwest, their direction, and their time of occurrence. "Peak Wind" is a 1-minute average, and "Peak Gust" is an instant reading. By my own personal methodology, a wind event rates the term "windstorm" when the average peak gust of these eleven stations reaches 39.0 mph (gale force) or higher. The February 5, 1965 windstorm exceeded this value by a decent margin, and almost made it well into moderate windstorm category. Moderate windstorms have an average of 45.0 to 54.9, and major windstorms are those that reach or exceed 55.0. Only a handful of storms have made the majors, including December 12, 1995, November 14, 1981 and October 12, 1962. The southern track, and relatively high central pressure, likely contributed to this storm's lower ranking relative to other storms. A deeper low probably would have produced a broader swath of high winds southward, and may have contributed to higher gusts north of the track. A track further north would have put more territory in the storm's south sector, which are favored for high winds. Source: Hourly data are from the National Climatic Data Center, unedited surface observation forms. |
| Location | Peak |
Direction |
Obs Time of |
Peak |
Direction |
Obs Time of |
| California: | ||||||
| Arcata | 23 |
150 |
22:58 HRS, 4th |
35 |
150 |
22:58 HRS, 4th |
| Oregon: | ||||||
| North Bend | 31 |
220 |
07:23 HRS, 5th |
52 |
210 |
06:55 HRS, 5th |
| Astoria [1] | 30 |
270 |
12:55 HRS, 5th |
47 |
290 |
12:15 HRS, 5th |
| Medford | 32 |
140 |
02:58 HRS, 5th |
39 |
140 |
02:58 HRS, 5th |
| Eugene [2] | 32 |
200 |
08:55 HRS, 5th |
49 |
200 |
06:43 HRS, 5th |
| Salem | 43 |
210 |
09:55 HRS, 5th |
58 |
200 |
10:58 HRS, 5th |
| Portland [3] | 46 |
190 |
11:56 HRS, 5th |
68 |
190 |
10:34 HRS, 5th |
| Washington: | ||||||
| Tatoosh I. | 40 |
270 |
18:08 HRS, 5th |
43 |
270 |
14:45 HRS, 5th |
| Olympia | 28 |
250 |
16:05 HRS, 5th |
35 |
250 |
16:05 HRS, 5th |
| Sea-Tac | 28 |
220 |
19:36 HRS, 5th |
38 |
200 |
19:57 HRS, 5th |
| Bellingham | 14 |
200 |
22:58 HRS, 5th |
21 |
200 |
22:58 HRS, 5th |
| AVERAGE | 31.5 |
211 |
44.1 |
209 |
Table 4 Notes: [1] Peak gust direction estimated from 12:07 PST "S" observation. [2] Peak wind is the last of two occurrences, the other having happened at 06:03 from 190 degrees. [3] Peak gust direction listed as SE on form 10B. Fastest mile was SE 58 mph at 10:35. |
Last Modified: July 30, 2004 You can reach Wolf via e-mail by clicking here. | Back | |