The Return of Warm Water to the NE Pacific
December, 2018
The intense marine heat wave (MHW) of 2014-16 in the NE Pacific, aka the “Blob”, received a great deal of attention and deservedly so. When relatively warm sea surface temperatures (SSTs) emerged in the Gulf of Alaska in late summer/ early fall 2018, both those monitoring the North Pacific atmosphere ocean climate system, and the media, began speculating whether a new MHW might be developing. We thought the readers of our newsletter might be interested in our current perspective on this potential event.
Reanalysis.
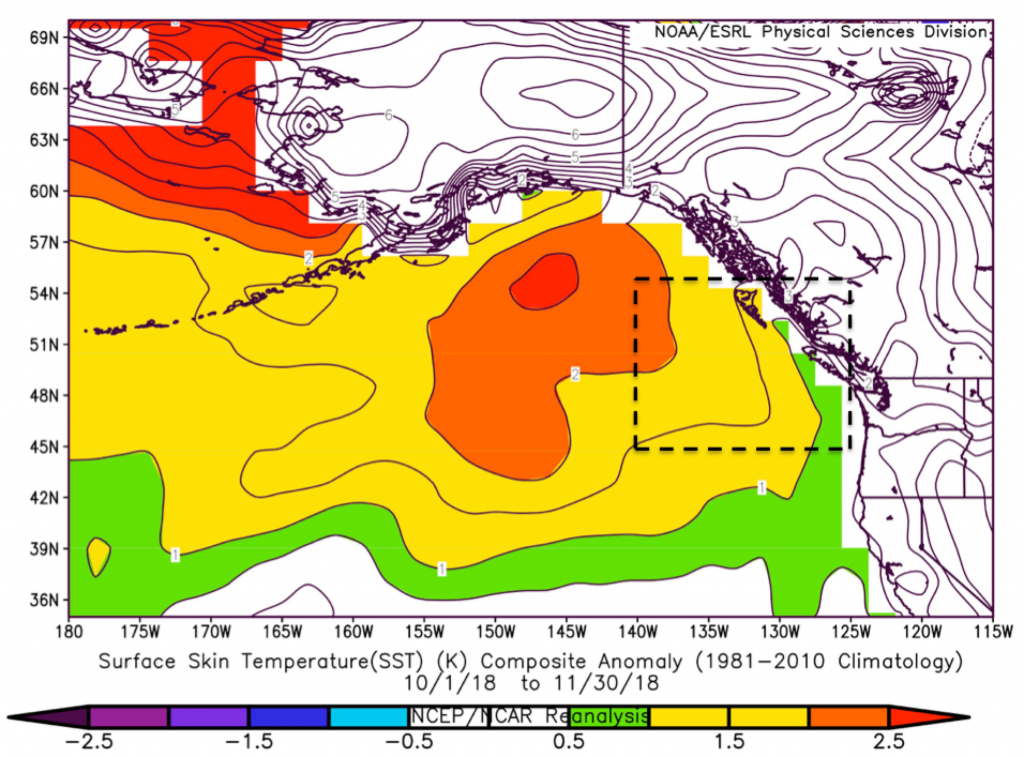
A map of the mean SST anomalies during the months of October and November 2018 is shown in Figure 1. We use October and November as an averaging period for characterizing recent conditions because while there is a lot more persistence in SSTs than air temperatures, there is some short-term variability (due mostly to the weather). The SST anomaly map reveals that much of the Gulf of Alaska has been more than 2°C warmer than usual, with anomalies exceeding 2.5°C in a small area in the central Gulf. This warmth can be attributed to the low-level atmospheric circulation over the NE Pacific and western North America during Sept-Nov 2018, which featured strongly positive sea level pressure (SLP) anomalies extending from western Canada across the Gulf of Alaska and southern mainland Alaska (not shown). Such a pattern implies suppressed storminess and hence reduced loss of heat from the ocean at the air-sea interface and also less mixing of colder water from depth in with surface waters. The SLP pattern also indicates wind anomalies from the east, which corresponds with near surface flow anomalies in the ocean from the south. The SSTs in the immediate vicinity of the coast of the Pacific Northwest have been between 0.5 and 1°C above climatology. There was a bit more upwelling favorable winds from the north than usual along our coast during July and August 2018 (not shown) that helped keep coastal ocean temperatures near normal.
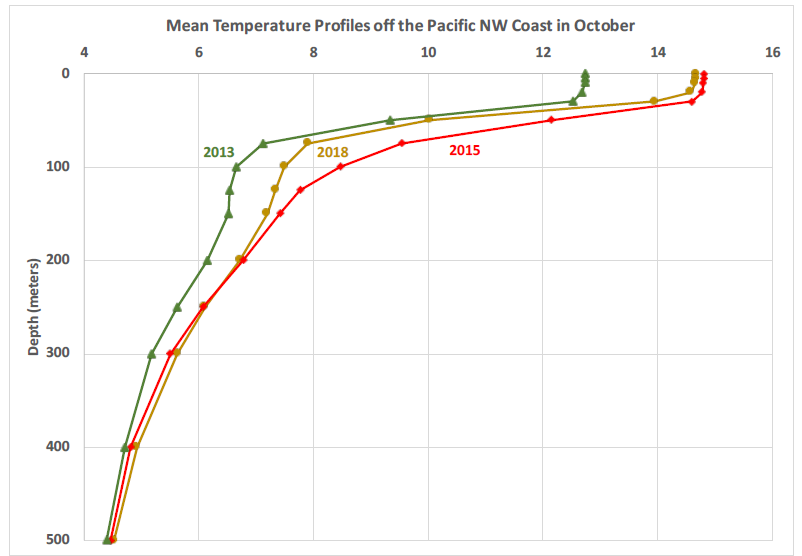
So how do recent conditions compare with the MHW of 2014-16? There are a number of ways to slice and dice it; for present purposes we focus on upper ocean temperature profiles. Specifically, we consider mean temperatures from the surface to 500 meters and for the region of 45 to 55°N and 140 to 125°W for the Octobers of 2013, 2015 and 2018. These three periods are chosen to represent temperatures prior to the 2014-16 MHW, during its heyday, and of course, the present situation. The source of this information is the gridded data from direct temperature observations collected as part of the Argo program, available at http://apdrc.soest.hawaii.edu/las/v6/dataset?catitem=2 among other data centers. The temperature profiles during the three Octobers are plotted in Figure 2. For the area selected here, the upper mixed layer (the top 25-30 meters) was only a bit less warm in 2018 than it was in 2015. In both years, the temperatures in this layer were about 2°C greater than those in 2013. On the other hand, the water was much warmer in 2015 than in 2018 at depths from the base of the upper mixed layer to about 150 meters. This extra warmth in 2015 can be attributed to the diffusion/exchange of heat from near the surface to deeper depths during that past MHW; the anomalous heat during 2018 is more confined to the surface. It is interesting that the temperatures from 200 to 400 meters were about the same in 2018 and 2015. This excess heat, relative to 2013, may represent a long-lasting residual from the historically strong MHW of 2014-16.
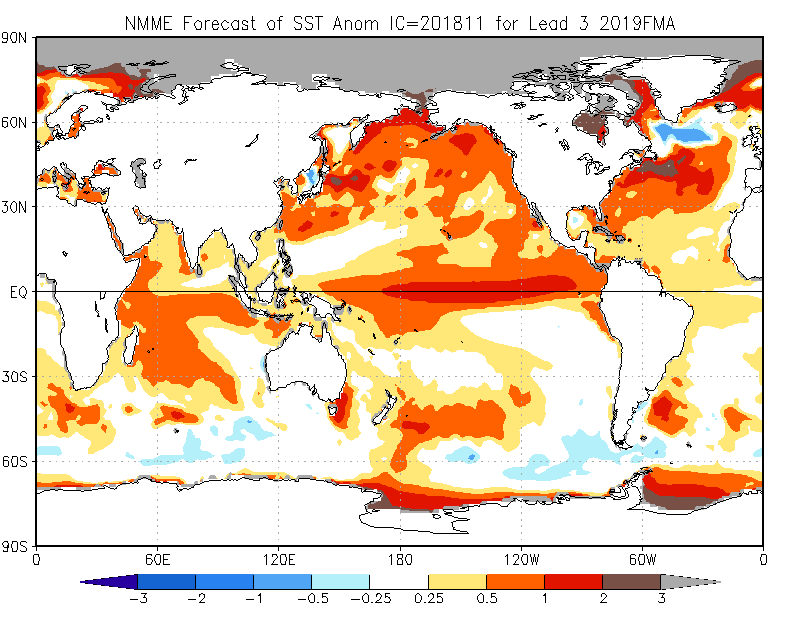
Once established, upper ocean temperature anomalies can influence air temperatures in coastal regions subject to prevailing winds that are directed onshore, and can definitely impact the marine ecosystem. How are the present anomalies liable to evolve over the next season or two? That question can be addressed using output from global climate models used for seasonal weather predictions. Figure 3 reproduces an SST anomaly map for the period of February-April 2019 from the latest simulations included in the National Multi-model Ensemble (NMME). The climate models as a group are projecting seasonal mean temperatures between 0.5 and 1.0°C warmer than normal off the coast of the Pacific Northwest. Warmer than normal, to be sure, but not nearly the magnitudes observed in early 2015 and 2016. Since all 7 models comprising the NMME are indicating positive SST anomalies (to varying extents) there is quite a bit of confidence that it will be on the warm side, as is often the case after El Niño winters.
National Multi-model Ensemble (NMME).