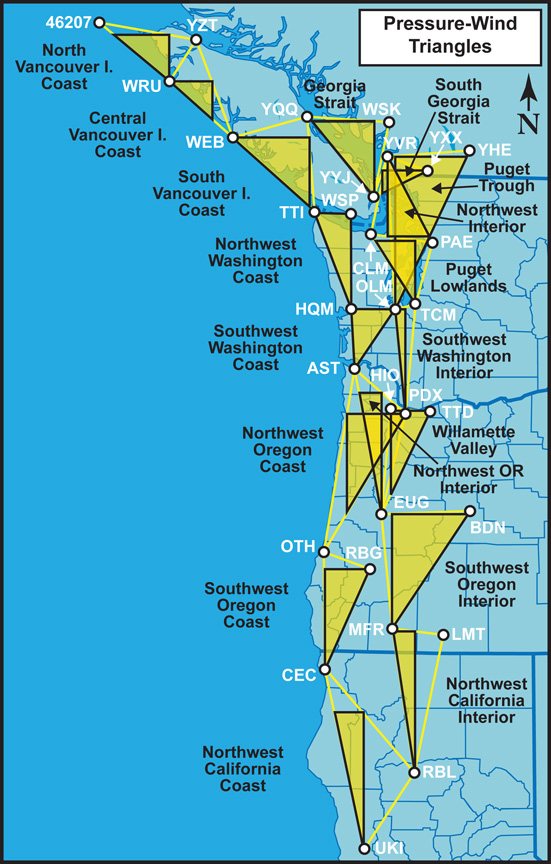
Figure 1.1 above Map showing the location and configuration of the pressure-wind triangles used for windstorm analyses. Click on the map for a larger version. |
Pressure-wind triangles are used for estimating the geostrophic wind speed and direction. This makes them particularly useful for estimating potential near-surface winds. The method for calculating geostrophic wind employed on The Storm King is from Stull (2015). Since the geostrophic wind speed is directly proportional to the pressure gradient--a doubling of the gradient results in a doubling of the wind speed--pressure-wind triangles are actually a method for calculating the pressure gradient magnitude. Having three endpoints provides a two-dimensional picture of the gradient, therefore allowing the computation of the pressure slope orientation (see Lange 1998 for discussion of pressure slope). The pressure slope orientation determines the geostrophic wind direction. Here, the output of the two-dimensional approach is called the absolute pressure gradient, as the estimate is very close to the actual gradient within the triangle and this value is usually larger than what two-station, or one-dimensional, pressure gradients would show. Here, station triads are used to estimate the absolute pressure gradient (Figure 1.1). Some pressure-wind triangle methods employ more stations and use regression for pressure gradient determination. Three stations is the minimum that is required to establish the two-dimensional picture of both pressure gradient magnitude and its orientation. Since the endpoints have to be in a right triangle for ease of calculations, and official weather stations are not arranged on a perfect grid, pressure interpolation points have to be used. Pressure interpolation is done linearly and this is almost certainly a source of error, especially in situations near an extratropical cyclone center where the pressure field may vary nonlinearly. Absolute pressure gradients are generally reported in hPa/100 km (hPa/62.1 miles), though on occasion different distances are used especially in situations where two stations in a triangle are also an important one-dimensional pressure gradient measure--the separation between these two stations may be used for distance. A standard distance allows for direct intercomparison between regions. When comparing regions, it is important to note the size of the given pressure-wind triangles. Smaller triangles are more sensitive to finer-scale details in the pressure gradient field. Larger triangles effectively average out variations over small spatial scales and may miss critical details in the pressure field. Ideally, all triangles would be the same size. This is not possible given the arrangement of official weather stations, though an effort has been made to keep triangle sizes similar. In a related vein, triangles with at least one dimension that is very narrow--in other words those with two stations very close together--are also more sensitive to any errors in pressure measurement. Longer distances between stations has the effect of averaging out some of the error. When selecting weather stations, those with the longest period of record were given the highest priority. Reporting sea-level pressure estimates, as opposed to station pressure and/or altimeter readings, provided the next criteria. For a few stations, altimeter is used. This includes North Bend and Bend, Oregon. In cases of altimeter readings for a high-elevation station, a two-step process of estimating station pressure and then sea level pressure is applied, using standard formulas. For low elevation stations altimeter is close enough to sea-level pressure that the two-step estimation process is not done--this is a source of minor error in the calculations. Further details about the pressure wind triangles used here can be found on the page "Is it Possible for a Pacific Northwest Windstorm to Ever Exceed the Peak Winds of the 1962 Columbus Day Storm?". This includes detailed illustrations of pressure-wind triangles and the geometry of pressure gradients within them, and further discussion of the geostrophic wind and its relation to near-surface wind speeds. |