|
The December 21, 1940 Sou'Wester compiled by Wolf Read |
|
|
|
December 21, 1940 witnessed the arrival of a "classic" sou'wester, one of a family of storms that includes the likes of Columbus Day 1962, November 13-14, 1981 and December 12, 1995. The National Climatic Data Center's Climatological Data for December 1940, Washington Section, has a short summary on this windstorm:
According to the December 1940 issue of the Monthly Weather Review (MWR), the December 21, 1940 cyclone followed closely on the heels of a massive 965 mb low that lashed the coastline from Oregon to southeast Alaska with gales of Beaufort force 9. Then:
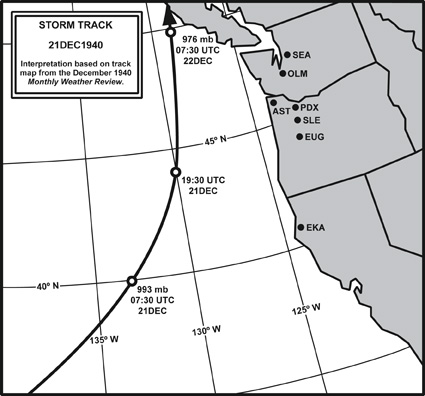
The December 21, 1940 storm has the distinction of being quite a warm one. As evidenced in the December 1940 MWR, monthly highs for much of northwestern California, Western Oregon and Washington were established on the 21st and 22nd, sometimes during the high wind episode triggered by the storm.Eureka, CA, had a high of 67 F on the 21st. On the same day, Medford reached 65 F, Roseburg reached 70 F, Portland 63 F, Seattle 63 F and Tatoosh Island 57. When considering these temperatures, keep a few things in mind: they occurred on the shortest day of the year, and for most locations, save Tatoosh, they stand far above the temperatures "around" the highs. Case in point, Roseburg for the 19th to 23rd: 63, 58, 70, 54, 54, and Portland for the same days: 50, 57, 63, 54, 56. At Portland, during the observation with the strongest winds, SSW 39 mph at 21:55 PST, the temperature was a "toasty" 61 F. Just 20 minutes before, at 21:35, the temperature had been 44 F--some of this had to do with the Columbia Gorge Effect, with strong east winds carrying cold air into the Portland area earlier in the day; the strong south winds eroded away this boundary, and the temperature sprang up. These are some of the warmest temperatures to show up during a Pacific Northwest windstorm. The Columbus Day storm produced similar results, but had an advantage owing to its occurrence in mid-October. Given the far south origination of the December 21, 1940 storm, it likely had a decent tropical connection. Indeed, there is some possibility that this cyclone incorporated the remains of a typhoon. As reported on the December 1940 MWR, a typhoon, tracked from December 8-19, 1940, passed within sixty miles of Guam and then flirted with the Philippines, before weakening and moving eastward. The typhoon had died by the 19th, but it's moisture could have been incorporated into the developing cyclone that would sweep the U.S. West Coast on the 21st and 22nd. Indeed, typhoon activity was fairly high during December 1940, with other west Pacific storms occurring on December 2-7, 1940, December 3-13, 1940, and one from December 18-22, 1940 that developed far to the east-northeast of Guam, perhaps close to Midway Island. With the very high temperatures noted on the U.S. Pacific Coast during the gale of December 21, 1940, the idea of a strong tropical connection is supported. Had this cyclone tracked closer to shore (see Figure 2, below), the windstorm may have been comparable to the great Columbus Day Storm of 1962. |
|
General Storm Data Figure 2, below, outlines the track of the December 21, 1940 cyclone's center. Compared to many significant classic events, this storm stayed fairly far offshore, tracking esentially along 130ºW until slamming into Vancouver Island. A rapid forward progress, coupled with a fairly deep center, likely contributed to the storm's strong impact ont he West Coast. A strong tropical connection, as evidenced by the deep souther origin of this system, likely contributed to the cyclone's ferocity.
From the December 1940 MWR, some ship reports provide data to help infer the depth of the December 21, 1940 storm. Table 1, below, lists the time, location and value of the lowest barometric pressure recorded by various vessels in transit:
Table 2, below, lists the barometric minimums for the December 21, 1940 storm at selected sites. Barometers over Northwest Oregon and Western Washington indicated fairly low readings, but many Pacific Northwest windstorms have produced lower values. Of interest is the rapid progression of minimums going from south to north. This suggests that the storm was moving at a fast pace--an important ingredient for high winds. The nearly uniform minimums from Eugene to Seattle suggest a storm track almost due north, though this assertion assumes that the cyclone wasn't undergoing significant pressure changes over the three hour period between minimums. Source: Hourly data are from the National Climatic Data Center, unedited surface observation forms. |
Table 2 Notes: [1] From 3-hourly observations. Last of two reports in a row with the same reading. [2] From 3-hourly observations. [3] Last of two hourly reports in a row with the same reading. |
|
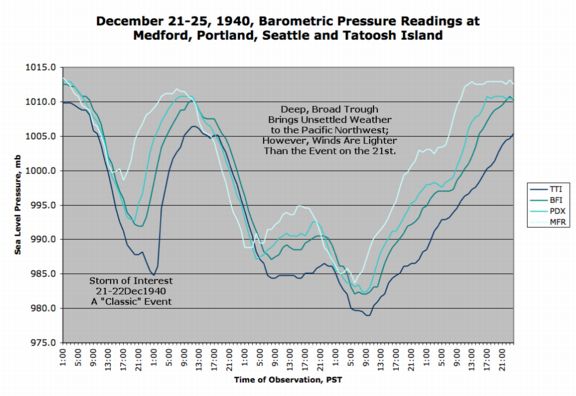
Figure 1, below, shows active barometers for the five-day period including the storm of the 21st. A later trough actually produced deeper minimums than the December 21st windstorm, but did not generate a significant gale inland. Focusing on the December 21st storm, there's a clear progression of "V"s, with increasing intensity from south to north along with progressively later minimums. This is the standard pattern of "classic" windstorms that move northward just off the Pacific coast. Notice the double-dip structure at Medford and Tatoosh Island, a common feature of these storms as well. It's interesting that the double dip is missing from Portland and Seattle. BFI is Seattle, Boeing Field. Source: Hourly data are from the National Climatic Data Center, unedited surface observation forms. |
|
Table 3, below, lists the maximum gradients for some approximately standard measures during the December 21, 1940 cyclone. Point Arena (PTA--my own designation) sits in for Arcata. Astoria/North Head, Boeing Field (BFI) sits in for Sea-Tac Airport, and Bellingham data are missing. The coastal gradients in this storm were quite strong. Inland, the numbers are fairly high, but not strongly so--gradients at this level or higher typically occur a few times each storm season. Source: Hourly data are from the National Climatic Data Center, unedited surface observation forms. |
Table 3 Notes: [1] Point Arena and North Bend-based gradients are from 3-hourly data. |
|
Pressure Tendencies The December 21, 1940 windstorm brought with it a decent "pressure couplet" over much of Western Oregon and Washington. Strong pressure surges (+3.0 mb and higher) were occurred from about Medford northward. Table 4, below, shows the maximum hourly changes in pressure for seven key stations in the Pacific Northwest. The +8.5 mb (+0.25") hourly surge at Tatoosh Island is among the highest for that particular station. Not even the Columbus Day storm, with a decidedly strong +6.2 mb (+0.18") surge, matched this value. Source: Microfilm copies of the unedited surface observation forms, obtained from the National Climatic Data Center. |
Table 4 Notes: [1] Point Arena and North Bend values are extrapolated from 3-hourly data. [2] The -2.4 mb drop at Seattle is the last of two occurrences, the other having happened in the hour before. Same with the +2.7 mb climb. |
||||||||||||||||||||||||||||||||||||||||||||||||||||||||||||||||||||||
|
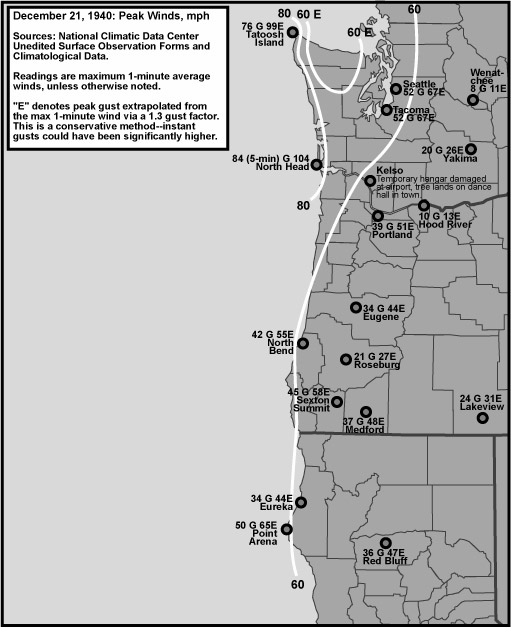
Table 5, below, lists the peak wind and gust for seven key stations in the Pacific Northwest, their direction, and their time of occurrence. "Peak Wind" is a 1-minute average, and "Peak Gust" is an instant reading. By my own personal methodology, a wind event rates the term "windstorm" when the average peak gust of eleven key stations reaches 39.0 mph (gale force) or higher. The December 21, 1940 windstorm surpassed this threshold, and rushed right into major windstorm category. Moderate windstorms have an average of 45.0 to 54.9, and major windstorms are those that reach or exceed 55.0. Only a handful of storms have made the majors, including December 12, 1995, November 14, 1981 and October 12, 1962. Due the four missing stations--actually five, for Point Arena has significantly different winds than the Arcata Airport (feel free to substitue the Erueka readings on the peak gust map above)--it's hard to compare the average values of this storm to those of later storms where the eleven stations are available. However, the maximum 1-minute winds for Tatoosh Island and Seattle are quite spectacular. Even for windy Tatoosh, an average wind over hurricane force is rare. And many blue moons can pass before Seattle sees average winds into the 50s. Putting the December 21, 1940 storm in the major category is probably justified. All peak gusts are extrapolated from the peak wind using a standard 1.3 gust factor, a conservative method. Gusts weren't noted very often during this time period. Source: Hourly data are from the National Climatic Data Center, unedited surface observation forms. |
| Location |
Peak |
Direction |
Obs Time of |
Peak |
Direction |
Obs Time of |
| California: | ||||||
| Point Arena [1] |
50 |
SE |
10:30 HRS, 21st |
65 |
SE |
10:30 HRS, 21st |
| Oregon: | ||||||
| North Bend [1] |
42 |
S |
19:30 HRS, 21st |
55 |
S |
19:30 HRS, 21st |
| Medford [2] |
37 |
SE |
13:35 HRS, 21st |
48 |
SE |
13:35 HRS, 21st |
| Eugene |
34 |
S |
19:35 HRS, 21st |
44 |
S |
19:35 HRS, 21st |
| Portland |
39 |
SSW |
21:55 HRS, 21st |
51 |
SSW |
21:55 HRS, 21st |
| Washington: | ||||||
| Tatoosh I. |
76 |
S |
01:30 HRS, 22nd |
99 |
S |
01:30 HRS, 22nd |
| Boeing Fld |
52 |
SSW |
00:35 HRS, 22nd |
67 |
SSW |
00:35 HRS, 22nd |
| AVERAGE |
47.1 |
S |
61.3 |
S |
|
Table 5 Notes: [1] Peak wind for Point Arena and North Bend are from 3-hour observations. [2] Peak wind last of two occurrences, with the other happening the hour before. |
|
Last Modified: November 29, 2007 | Back | |