Sheltering in Place – Does it Impact Air Quality?
4/1/2020
We have all noticed marked changes in activities due to the COVID-19 outbreak. One obvious one is the scarcity of aircraft overhead, as indicated by Alaska Airlines planning to reduce its flights by 70% for April and May (Seattle Times, 26 March 2020). Another one is reduced automobile traffic, especially involving personal vehicles. Is this having any noticeable impacts on pollution levels? Let’s see.
Before we really get started, it is worth recognizing the relevant improvements in automobile technology over the last few decades. Most of the credit goes to the development and installation of catalytic converters, which reduce the emission of noxious by-products such as carbon monoxide, hydrocarbons, and nitric oxides (NOx) by something like 90%. The Los Angeles basin has certainly benefited from the adoption of this technology; air quality these days is far superior to that of the 1960s and 1970s even though there are many more vehicle miles per day. That being said, cars still produce NOx among other pollutants, and so we thought it might be interesting to look at recent data and see how levels compare with those before we were all hunkering down. Credit is given here to Lynda Mapes of the Seattle Times, who brought up the subject during a recent interview.
The data we use here was extracted from the application maintained by the Puget Sound Clean Air Agency at: https://secure.pscleanair.org/airgraphing. The two locations for which NOx data are available are Seattle (10th and Weller) and Tacoma (S 36th). In a way it is too bad there is not another more pristine location for comparison, but so be it. Of course Seattle and Tacoma are places where the effects of automobiles, and associated impacts of changes in use, should be more evident.
One way to gauge the typical effects of automobile traffic on NOx concentrations is to consider how NOx values vary with time of day, using past hourly data. Towards this end, we grabbed the data from the last week of March 2019. This period was generally warmer than what the region has experienced in late March of 2020, but it did include a couple of days with measurable rain, and hopefully it is representative of typical NOx conditions during the time of year. The average concentrations of NOx at Tacoma and Seattle as a function of time of day for the period of 25 March through 1 April 2019 are plotted in Figure 1. The record from both stations features a peak early in the day, specifically 8 AM local time in Tacoma and 11 AM in Seattle. We interpret these peaks due to the enhanced emissions accompanying the morning rush hour; we have no explanation for the difference in timing save that it is liable to relate to local effects such as winds, mixing heights, and station siting. We reckon that the greater atmospheric mixing causes the declines over the course of the afternoon found for both locations. Minor bumps show up at 6 PM in Tacoma and 5 PM in Seattle. We also looked at the daily peaks in NOx at the Seattle station over the last week of March and first week of April of 2019 (not shown). Over that period, 11 of the peaks occurred in the morning, and 3 occurred from 1 PM to 7 PM. The important point here is that NOx concentrations in the higher population areas of the Puget Sound region are reduced during the evening and late night hours when traffic is lighter.
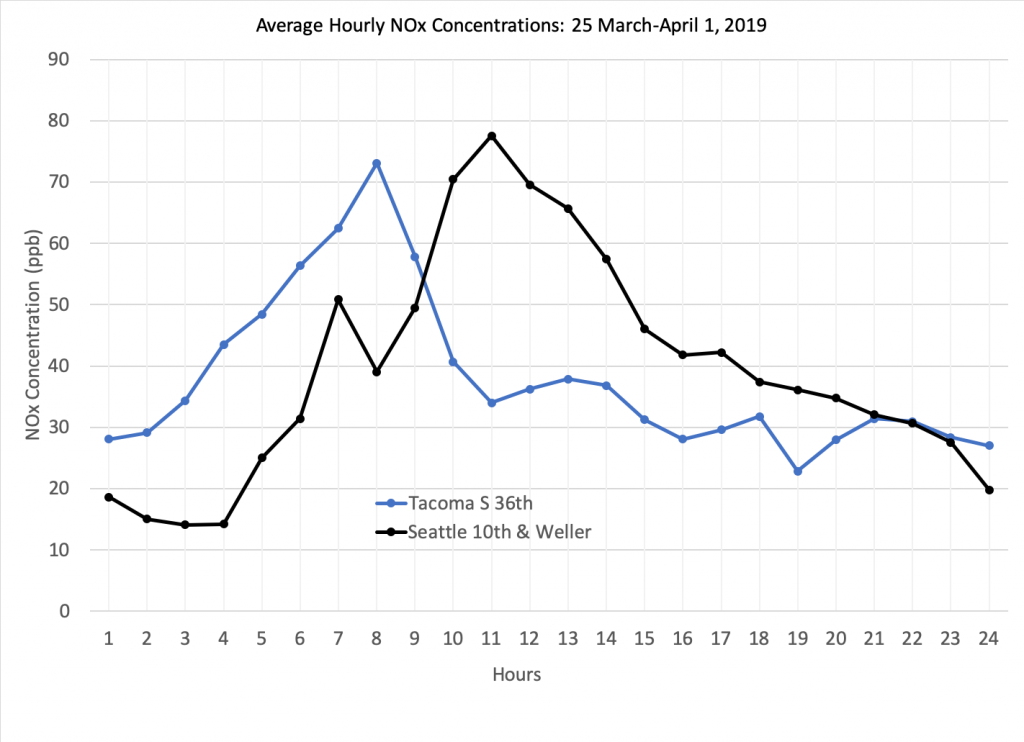
week of 25 March through 1 April , 2019 (from PSCAA).
Given that cars impact NOx levels, has there actually been a reduction in recent days? You can see for yourself in the time series of daily mean NOx concentrations at the two stations in Tacoma and Seattle for the month of March 2020 plotted in Figure 2. The last week of the month has included generally lower values, and a slight decreasing trend in NOx is apparent if you squint at the plot, but there has not been that much of a decline. It may be too soon to tell if our sheltering in place has made much difference in air quality. There is inherent variability in day to day mean values having to do with the local weather. For example, the high values from 17 through 20 March coincided with a period of relatively low wind speeds. There were especially high concentrations during the early morning of those days; the pollutants emitted those days must have been trapped within a shallow layer near the surface to a greater extent than usual. As an aside, carbon monoxide (CO) concentrations from the Seattle station (not shown) have varied in a similar way to NOx over the month of March 2020. Lots of us are trying to cope with cabin fever by walking, running, and biking in our neighborhoods, and while it is by no means a saving grace, at least there is some hint that the air quality could be improved in urban areas in the coming weeks.
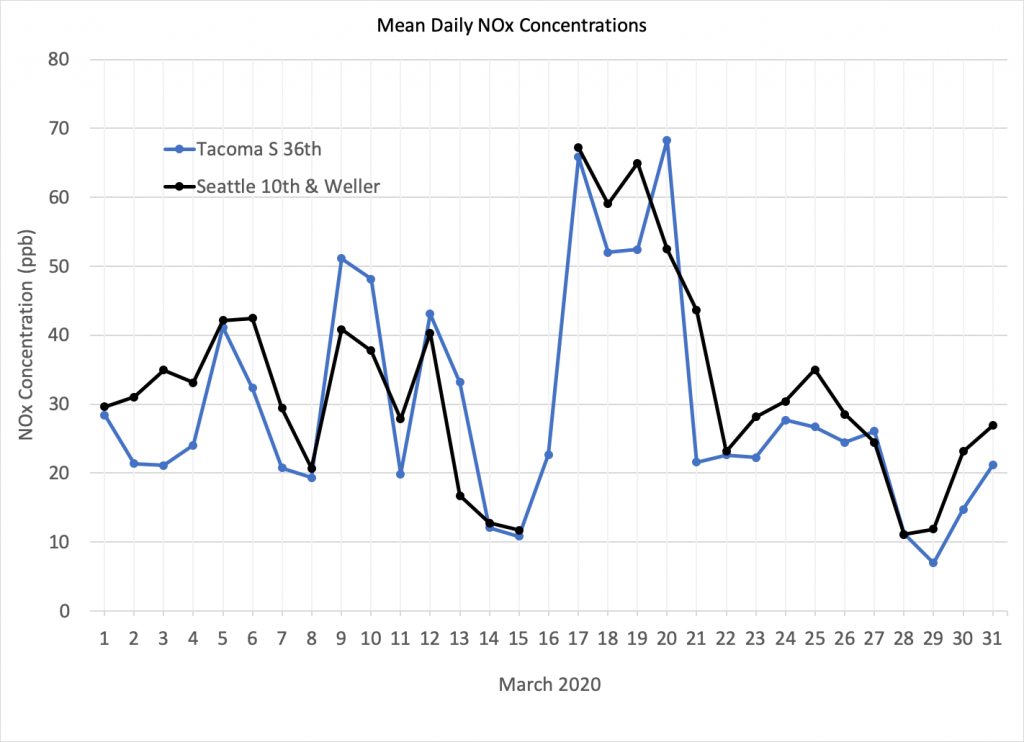
2020 (from PSCAA).