OVERVIEW OF MAP
Click on the red areas for further information
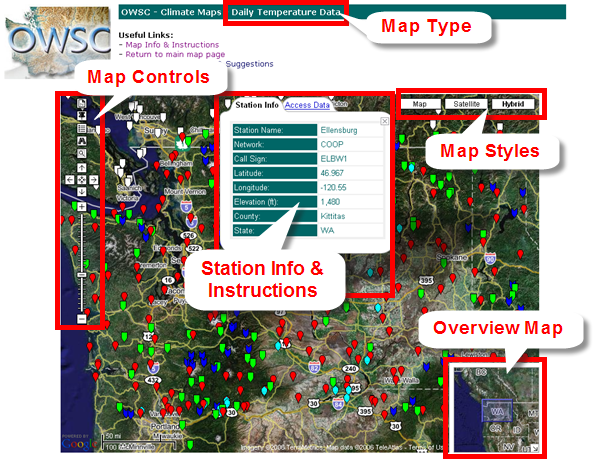
Map Type
Displays the type of map that is currently being viewed.
Available maps include 15-minute, hourly, daily, and monthly
periods of temperature, precipitation, snow, wind, dewpoint/humidity,
solar radiation, and other (may include pressure, cloud
cover, evaporation and/or soil moisture data).
-Return to Top
Map Styles
Map: Normal Google Style Street Map
Satellite: Google Earth Satellite Images
Hybrid (default view): Transparent street map over Google Earth Satellite Images
-Return to Top
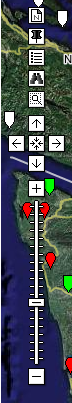
Controls
|
 |
Click the 'New Map' button to generate a new map with different parameters. |
|
 |
Click the 'Plot Reference Point' button to display a form
that allows you add a point on the map. Useful for finding
stations around a location (zip code, city, lat/long or
address). For example, a point on the map can be added by inputting 48.00 -122.12 |
|
 |
Click this button to display
the 'Legend' and obtain information about the various
networks. |
|
 |
'Search' button used for finding stations by network,
elevation, county, name or keyword. |
|
 |
Use 'Zoom Box' button for zooming on a particular area
of your choosing. To use, click this button, then click somewhere on the map (not on a station/marker).
Then move your mouse outward from that point (a dotted-line white box will appear) and click on another
point on the map (not on a station/marker). The map will then center and zoom in on the location in the box. |
|
 |
Re-center the map and pan or move the map up, down, left or right. |
|
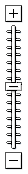 |
Click the + or - symbols to zoom in or out on the map or
click and drag the slider up or down. |
-Return to Top
Overview Map
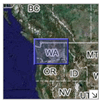
The 'Overview Map' is located in the bottom right corner of
the main map. The blue box represents the current area
that the map is centered on and this box can be clicked on to pan or move
the center on the main map. To hide the overview map,
click the arrow located on the bottom right corner of the overview map.
-Return to Top
Station Information &
Data Access Instructions
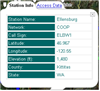
When a marker or point corresponding to a station is clicked on, a
'balloon window' appears with information about the station. To
close the balloon window, click the 'X' icon in the upper right
corner of the balloon window or simply click on another station.
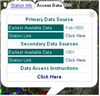
To view the instructions on how to get data from the station, click on the 'Access Data' tab at the top of
the balloon window. You will now see a 'Primary Source' and a 'Secondary Source' with the month (not
in all cases)
and the year in which data began being archived. To access the data, click where it says 'Click Here'
under the 'Data Access Instructions'.
 Once the instruction link is clicked, a window with instructions on
how to access the data for that station will pop-up. Note users that have pop-up blockers enabled, may not see the
pop-up window with the instructions displayed and will have to consult the documentation for their web browser or popup blocker to
view the instructions. Users of Firefox 1.0 will have to turn off their pop-up blocker or enter an exception for the site
(refer to the Firefox documentation for assistance). Firefox 1.5 users will likely not
encounter this problem.
Once the instruction link is clicked, a window with instructions on
how to access the data for that station will pop-up. Note users that have pop-up blockers enabled, may not see the
pop-up window with the instructions displayed and will have to consult the documentation for their web browser or popup blocker to
view the instructions. Users of Firefox 1.0 will have to turn off their pop-up blocker or enter an exception for the site
(refer to the Firefox documentation for assistance). Firefox 1.5 users will likely not
encounter this problem.
The instructions are displayed at the top of the window (top frame). Follow the instructions exactly as they are listed in order
to access the data. In some cases there will be multiple methods to obtain data for a particular station. Use the scroll
bars to the right of the instructions to view the additional methods. You may have to refer back to the map page where the
balloon window is located for that station and click the 'Station Link' to obtain the data. When the station link is clicked,
the website will appear in the same pop-up window just below the instructions. The top frame where the instructions resides,
can be resized if necessary.
-Return to Top