 |
|
A Review of Winter 2015-2016
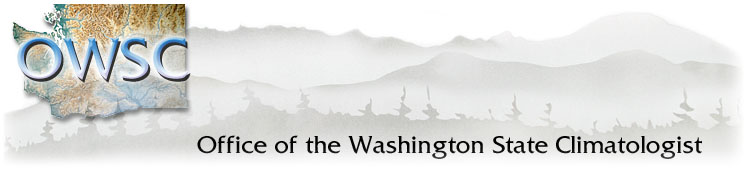
4/29/2016 In the fall of 2015, impacts remained from a statewide drought that began as a snowpack deficit in the winter of 2014-15 and was made worse by a record warm and dry spring. Therefore, the forecasts made in the fall of 2015 for the upcoming winter were concerning. An El Niño was already in place during the fall of 2015, and was expected to intensify, with seasonal forecasts calling for a warm and dry winter. So how did the winter actually play out? This report summarizes the winter El Niño-Southern Oscillation (ENSO) conditions, snowpack, average temperature and precipitation anomalies for Washington State, and the seasonal variations in the weather. Figure 1 shows the sea surface temperature (SST) anomalies from January 2008 through March 2016 in the Niño 3.4 region of the equatorial Pacific Ocean. SSTs exceeded 2 degrees Celsius from October 2015 through February 2016 in the tropical Pacific, classifying this event as the strongest El Niño in 18 years. In fact, the 2015-16 El Niño ranks among the three strongest El Niño events on record (since 1950). Different indices rank the events differently, but 2015-16 is in the company of the historic El Niño events in 1982-83 and 1997-98. Tropical SST anomalies have moderated, and ENSO models indicate that neutral conditions will exist by summer. There are indications of a La Niña developing by next fall, but these forecasts will become more reliable this summer. 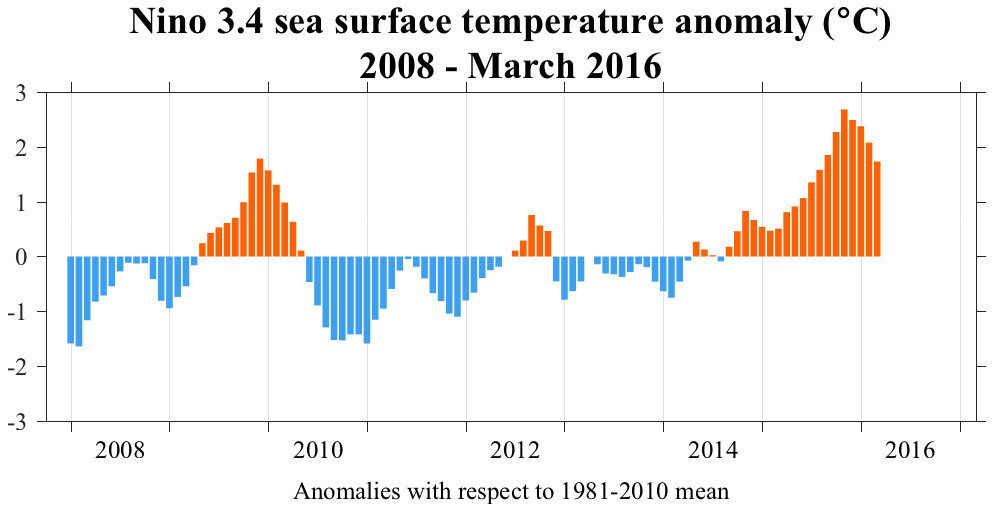
Figure 1: SST anomalies from January 2008 through March 2016 in the Niño 3.4 region of the tropical Pacific (figure by Todd Mitchell - JISAO). Please click on the figure to see the full-size image. Historically, the Pacific Northwest experiences warmer winters with dry conditions and reduced snowpack during a positive ENSO event. The two strongest El Niño events on record - 1982/83 and 1997/98 - were a little different for WA State, however. October through March in both years was warmer than normal, but precipitation was above normal in 1982/83 (6.40" above normal averaged statewide) and near-normal in 1997/98. It appears as if the strong El Niño event of 2015-16 followed a similar pattern. Figure 2 shows the mean October through March temperatures compared to the 1981-2010 normal for WA State. Temperatures were above normal, though not as warm as the record warmth measured during the winter of 2014-15. This past winter was 2.3 degrees Fahrenheit above normal, averaged statewide, with some areas of the northern Cascades and northeastern WA experiencing larger temperature anomalies between 3 and 4 degrees F. As for precipitation, the total Oct-Mar precipitation was much above normal (Figure 3). Averaged statewide, it was the 6th wettest Oct-Mar on record with 10.55" above the 1981-2010 normal. Some locations on the eastern slopes of the Cascades received much more precipitation than usual, exceeding 180% of normal for the season. The 2015-16 winter can definitely be classified as "warm" and "wet". The scatterplot in Figure 4 shows statewide average temperature and total precipitation for each Oct-Mar since 1950 (i.e., each blue diamond is a winter season). Oct-Mar 2015-16 is labeled and is unusual in the sense that there have not been many other winters that were comparably both as warm and wet. Separating the season into two periods, Oct-Dec and Jan-Mar does not change the story - both 3-month periods were similar to the winter as a whole. 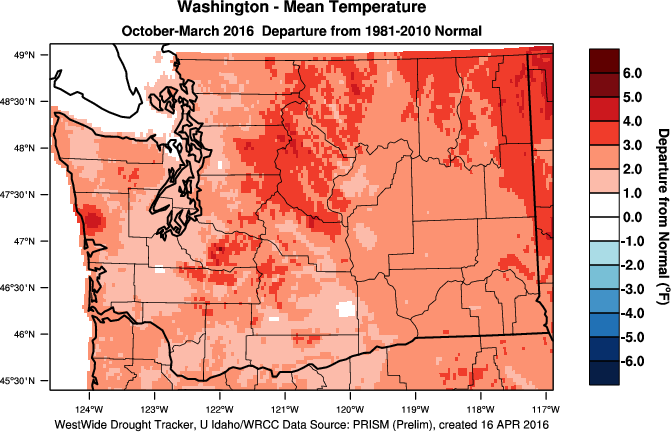
Figure 2: Oct-Mar 2015-16 temperature anomalies (Fahrenheit) from the 1981-2010 normal. Note that the area of positive 4-5 degrees F anomalies in Grays Harbor County is an artificial remnant of a malfunctioning station. Read more here. Please click on the figure to see the full-size image. 
Figure 3: Total Oct-Mar 2015-16 precipitation percent of normal (from WestWide Drought Tracker). Please click on the figure to see the full-size image. 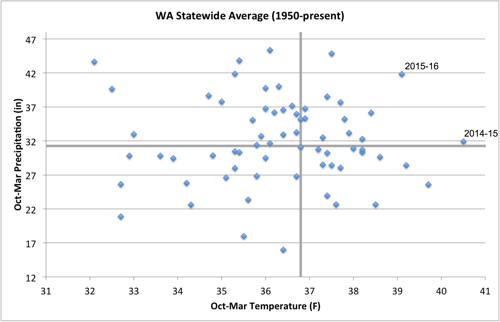
Figure 4: Statewide averaged October through March total precipitation and average temperature from 1950 through present. The blue dots representing this winter and last winter are labeled. The gray lines represent the 1981-2010 temperature and precipitation normals. Please click on the figure to see the full-size image. The average winter conditions provide one perspective on the past winter, but it is also worthwhile to consider the progression of the weather over the course of the season, and the notable weather events. October was much warmer than normal across the entire state, but precipitation was variable; most of eastern WA received below normal precipitation. The last week of the month brought snow to the Cascades, but as of early November, snowpack was low compared to normal. November was cooler than normal, and brought above normal precipitation to western WA (with several periods of moderate flooding), but eastern WA was still drier than usual (yet had a strong windstorm). Aside from the Olympic Mountains, snowpack was below normal at the end of the month. December changed that, however. December was extremely wet, with above normal snow in eastern WA and above normal snowpack by the end of the month, despite warmer than normal December temperatures. There was one particularly wet week in December (18-24) that brought significant snow to the Cascades, causing Snoqualmie Pass to close and impacting holiday travel. Each month from January through March remained warmer than normal statewide, and precipitation was mostly above normal for western WA locations for each month as well. March also brought back-to-back windstorms that caused fallen trees, power outages, and a fatality. In eastern WA, January and March were wetter than normal, but February was drier than normal. 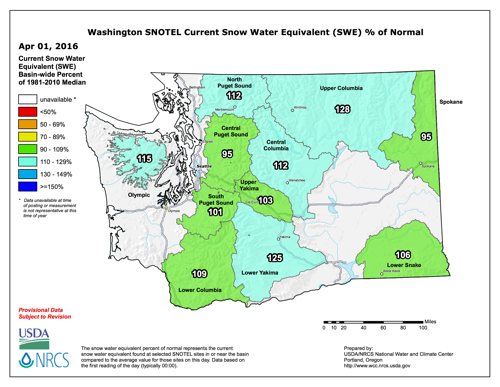
Figure 5: Snowpack (in terms of snow water equivalent) percent of normal for WA as of 1 April 2016 (from NRCS). Please click on the figure to see the full-size image. Despite the warmer than normal temperatures during the winter season, the above average precipitation brought snow to the state's mountains. The wet December was especially helpful towards building the state's snowpack. Figure 5 shows the average basin snow water equivalent (SWE) percent of normal throughout WA as of 1 April. The SWE was near-normal throughout the state at the typical peak in accumulation season, with some basins averaging above normal. Since then, very warm April temperatures have caused earlier than usual runoff. Figure 6 shows the SWE percent of normal at the time of this writing, with much of the state's SWE well below normal. The Central Puget Sound, Upper Columbia, and Spokane basins all have about 63% of normal SWE, and are currently the lowest in the state. Conditions are being monitored at the state level, and fortunately the National Weather Service Northwest River Forecast Center's April through September water supply forecast (Figure 7) projects normal to above normal streamflow for most of the state. A few locations - the Spokane River, the Cowlitz River, and the Dungeness River - have a below normal forecast of about 85% of normal for the April through September period. 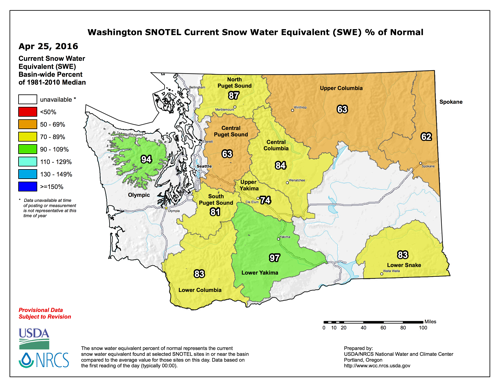
Figure 6: Snowpack (in terms of snow water equivalent) percent of normal for WA as of 25 April 2016 (from NRCS). Please click on the figure to see the full-size image. 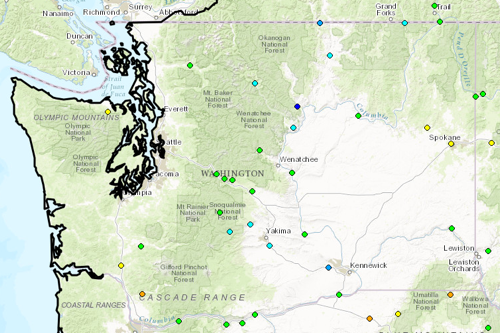 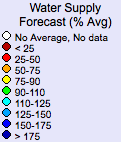 Figure 7: April through September 2016 water supply forecast for WA as of 25 April 2016 from the National Weather Service River Forecast Center. In summary, the winter of 2015-16 featured warmer than normal temperatures and above normal precipitation. While El Niño generally brings drier than normal average winter conditions to WA, the 3 strongest events on record (including 2015-16) have not fit that pattern. Though the snow season started out slowly, an active December ensured near-normal snowpack in the mountains by the end of the accumulation season. Recent April warmth has started melting snow earlier than usual, and streamflow forecasts will be watched as spring progresses.
|


 |