OVERVIEW OF MAP
Click on the yellow boxes or balloons for further information
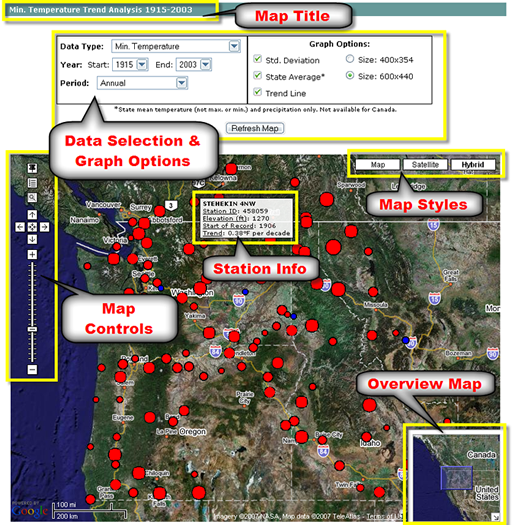
Map Title
Displays the parameter (temperature, precipitation, etc.) and period that is currently being viewed.
-Return to Top
Map Styles
Map: Normal Google Style Street Map
Satellite: Google Earth Satellite Images
Hybrid (default view): Transparent street map over Google Earth Satellite Images
-Return to Top
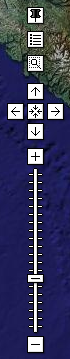
Controls
 |
Click the 'Plot Reference Point' button to display a form that allows you add a point on the map. Useful for finding stations around a location (enter a zip code, city, lat/long or address). |
 |
Click this button to display the 'Legend'. |
 |
Use 'Zoom Box' button for zooming on a particular area of your choosing. Click an area on a map that is away from any circle (station marker) and move your mouse out from that point and click another area on the map. |
 |
Re-center the map and pan or move the map up, down, left or right. |
 |
Click the + or - symbols to zoom in or out on the map or click and drag the slider up or down. |
-Return to Top
Overview Map
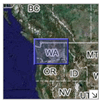
The 'Overview Map' is located in the bottom right corner of the main map. The blue box represents the current area that the map is centered on and this box can be clicked on to pan or move the center on the map. To hide the overview map, click the arrow located on the right corner of the overview map.
-Return to Top
Station Information
When the mouse cursor is put over the circle or marker corresponding to a station, a box appears with information about the station.
The information includes station id, station name, elevation, start of record, trend per decade, and percent change (for precipitation
and SWE only).
-Return to Top
Data Selection & Graph Options
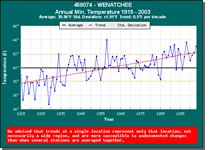
Use these options to change the map display and the parameters that are displayed on the graph. To view the graph for a particular station, click on the marker or circle that represents the station of interest.
A graph will then popup in a new window displaying the observed data along with plots for the mean, state average, standard deviation, and linear trend line.
NOTE:
- Temperature and precipitation data is only available through 2005 for U.S. stations and 2004 for stations in Canada.
- SWE data is only available from 1930 - 2006.
- Under graph options, when state average is selected, it will graph state mean temperatures and precipitation. State averages are not available for max. temperature, min. temperature,
SWE, and stations in Canada.
- If the graph does not appear, you may need to temporarily disable your popup blocking software.
-Return to Top