|
January 1, 2006 Windstorm compiled by Wolf Read |
|
|
|
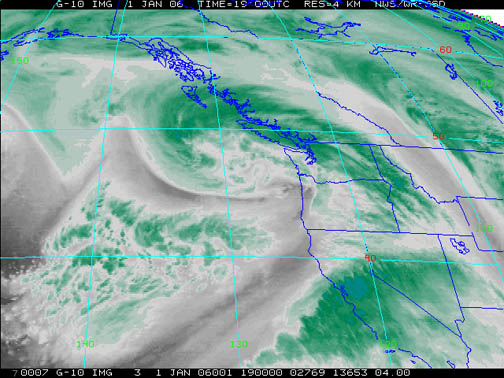
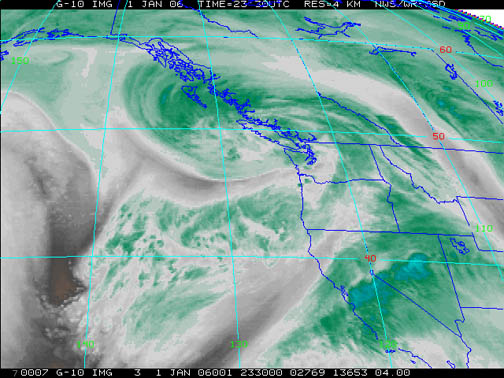
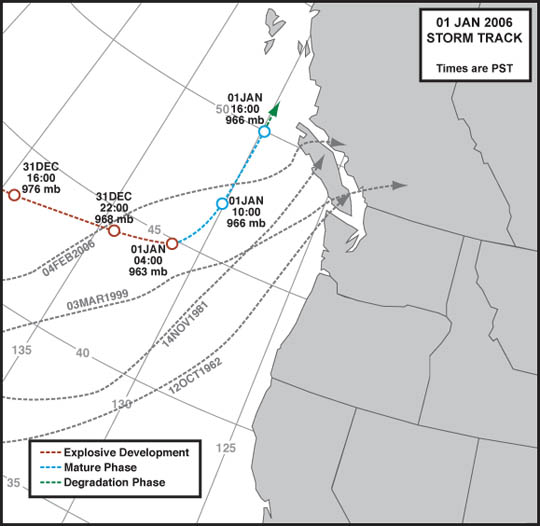
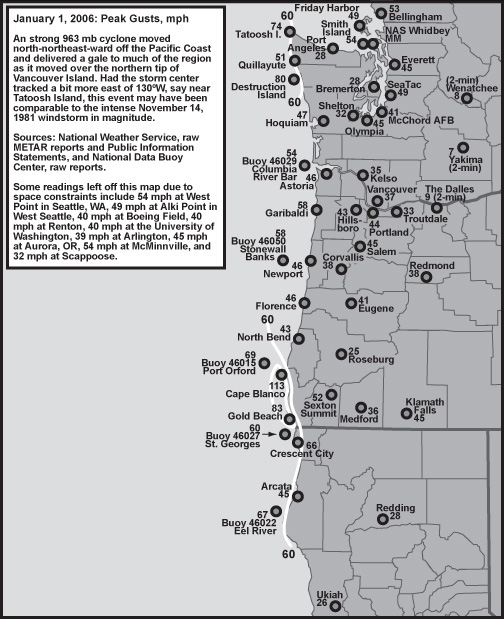
On December 31, 2005, a rapidly deepening cyclone moved toward the Oregon coast. By the morning of January 1, 2006, the intense system had deepened to 963 mb (28.44"). As the powerful low neared 130ºW, the system suddenly hooked north-northeastward right along 130 W and skirted the north tip of Vancouver Island after nightfall. This cyclone's lowest pressure of 963 mb approached the central pressure minima of big windstorms like October 12, 1962 and November 14, 1981. However, the January 1, 2006 low tracked much further offshore, and this likely spared much of the Pacific Northwest a seriously damaging wind. Nevertheless, the storm packed a punch on the Northwesterrn California and Southern Oregon coastline, with gusts reaching 113 mph at often-windy Cape Blanco, 83 at Gold Beach and 66 at Crescent City. The Pacific coastal islands of Washington were also lashed fairly hard, with gusts as high as 80 mph at Destruction Island and 74 at Tatoosh. In some ways, this system seemed to be a blend of the standard "southeast sucker" type scenario, of which December 14, 2002 is a good example (as is November 10, 1983), and a classic event like November 14, 1981, albeit a more tamed version. The location of the highest wind velocities during the January 1, 2006 event has the flavor of a southeast sucker, yet many interior areas received wind gusts into the 40 mph, and sometimes 50 mph, range, which is uncharacteristic of a southeast sucker, but more characteristic of a moderate classic event. Such a blend fits with a low that tracked approximately northward near 130ºW, which puts it on a gray area between the two scenarios. Here are my journal notes: |
|
|
|
|
|
|
|
|
January 1, 2006: Comparative Meteorological Details |
|
Storm Track
The January 1, 2006 cyclone tracked far offshore relative to more significant events in the past. Depth of central pressure made up for some of this distance, and the New Year's storm managed to produce gale-force gusts throughout much of the western Pacific Northwest even as it raced northward along the 130ºW line. |
|
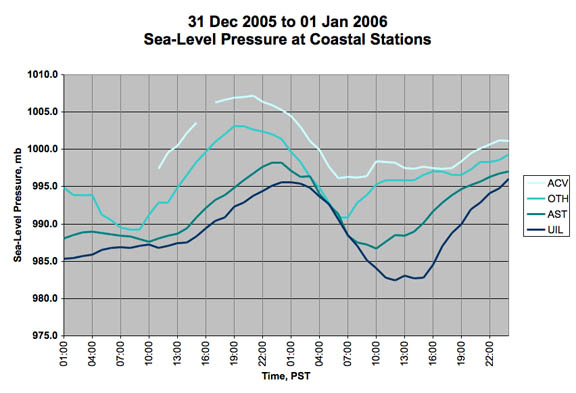
General Storm Data Barometric Minima Table 1, below, lists the barometric minimums for the January 1, 2006 storm at selected sites. The values that occurred in the storm were quite low; however, many Pacific Northwest windstorms have produced significantly lower readings. The most depressed pressures during the 2006 storm were along the tip of the Olympic Peninsula, and included 28.98" (981.5 mb) at 16:00 on the 1st at Tatoosh Island, and 28.97" (980.9 mb) at Destruction Island at 11:00 on the 1st. From south to north, minimum pressure generally occurred later in the day, the mark of a classic northward-moving cyclone event. The temporal spread of peak wind and gust also generally follows the classic pattern, with an early morning strike in northern California, mid-and-late morning through much of Oregon, early afternoon in southwest Washington and the Puget Lowlands and finally in the evening for the Northwest interior. Sources: National Weather Service, Portland and Seattle offices, METAR reports, and the National Data Buoy Center, real-time meteorological data. |
Table 1 Notes: [1] Quillayute METAR reports stopped arriving for many hours after 23:53 report, presumably due to power outage. Based on readings at Destruction and Tatoosh Islands, which had their minima occur between 04:00 and 07:00, the value for UIL is likely a bit high. [2] Bellingham METAR reports missing between 23:50 and 16:50 PST, which likely covers the time period of minimum pressure. The noted value is likely a bit high. |
|
|
Pressure Gradient Maxima Table 2, below, lists the maximum gradients for some standard measures during the January 1, 2006 cyclone. With the exception of the AST-DLS gradient, which is about expected, the values in the table are exceptionally low a cyclonically-generated windstorm in the Pacific Northwest. Most high-wind producers have gradients two to three times as steep! Given that 5-second wind gusts of 41 to 53 mph struck many interior stations, which support brief (1-second) wind gusts of 45 to 60 mph at these locations, the low gradients are particularly intriguing. Strong gradients and sharp pressure tendencies (see Table 3, below) aren't always required for a solid gale. Likely convective activity along the storm's front played a role in the high wind speeds, mixing down momentum from the upper atmosphere. An important measure for estimating the wind velocity potential for the Northern Willamette Valley, the EUG-OLM gradient, reached +5.7 mb (+0.17") at 12:00 on the 1st. Weak. This value supports an expected wind gust of about 20 mph at Portland. With a peak 5-second gust of 44 mph at this station, the unusual nature of the January 1, 2006 windstorm is demonstrated. Sources: National Weather Service, METAR reports, and the National Data Buoy Center. |
Table 2 Notes: [1] Last of two occurrences, the other having happened at 15:00. |
|
Pressure Tendencies Table 3, below, lists the maximum hourly pressure tendencies recorded at eleven key stations during the January 1, 2006 event. None of these tendencies stand out next to past windstorms, save maybe the sharp drop of -3.5 mb (0.10") in one hour at Portland. Pressure declensions were faster than rises with this storm, which is somewhat backwards, though not unheard of by any means. Sources: National Weather Service, METAR reports, and the National Data Buoy Center. |
Table 3 Notes: [1] The -2.0 mb fall is the last of three hourly occurrences, the others having happened at 05:00 and 03:00 HRS on the 1st. [2] The -2.0 mb fall is the last of two hourly occurrences, the other having happened at 05:00 HRS on the 1st. [3] The -2.1 mb fall is the last of two hourly occurrences, the other having happened at 06:00 HRS on the 1st. |
||||||||||||||||||||||||||||||||||||||||||||||||||||||||||||||||||||||||||||||||||||||||||
|
Peak Wind and Gust Table 4, below, lists the peak wind and gust for eleven key stations in the Pacific Northwest, their direction, and their time of occurrence. "Peak Wind" is a 2-minute average, and "Peak Gust" is a 5-second average. By my own personal methodology, a wind event rates the term "windstorm" when the average peak gust of these eleven stations reaches 39.0 mph (gale force) or higher. The January 1, 2006 cyclone ranked a moderate windstorm. Moderate windstorms have an average of 45.0 to 54.9, and major windstorms are those that reach or exceed 55.0. Only a handful of storms have made the majors, including December 12, 1995, November 14, 1981 and October 12, 1962. Of particular interest is how this windstorm compared to some of the others in recent memory. More specifically, how much time has passed since an event of equal or stronger magnitude occurred. With an average peak gust of 45.2 mph, the January 1, 2006 windstorm was the strongest event since January 16, 2000, which had an average peak gust of 52.5 mph at the eleven key stations used in this comparative data section. The March 3, 1999 windstorm, often cited as the strongest since December 12, 1995 in the modern ASOS era, wasn't quite as powerful wind-wise as its 2000 cousin with an average peak gust of 51.5 mph. However, the "strongest since January 16, 2000" title did not last long, as the February 3 - 4, 2006 windstorm exceeded the January 1, 2006 event in average peak gust. In the ASOS era, the windstorm that the January 1, 2006 event most closely approximates is the January 1, 1997 gale that followed a major flood-and-mudslide-producing Pineapple express that wreaked havoc over the New Year's holiday, and the February 3 - 4, 2006 windstorm. Both the Jan 1997 and Feb 2006 events had an average peak gust of 46.8 mph. Note that, with a conversion from 5-second to the "instant" gusts recorded before the Automated Surface Observation System, the January 1, 2006 storm ranks in the upper range of this category, with a value of 53.8. Both the January 1997 and February 2006 windstorms have an adjusted value of 55.7. Rankings in the mid-50s mark significant events that tend to result in high-wind-criteria instant-gusts at some interior locations. For more explanation on how the 5-second and 1-second gust measures play into the kind of storm ranking system I describe here, see "Adjustments to Modern Storms." Also, peak wind is the highest value noted in the regular and special reports, and may not reflect the true maximum 2-minute average. For example, Portland's actual peak 2-minute wind was 35 mph on the 1st, as noted by the ASOS automatic recording capability. Before ASOS, there wasn't always a means to witness the actual maximum wind, and it was often taken from the regular and special observations. The methodology is done similarly in this table to provide information that is more comparable to the storms that occurred before ASOS (pre-mid-1990s). Sources: National Weather Service, Eureka, Portland and Seattle offices, METAR reports, and Public Information Statements. |
| Location |
Peak |
Direction |
Obs Time of |
Peak |
Direction |
Obs Time of |
| California: | ||||||
| Arcata [1] |
28 |
130 |
06:53 HRS, 1st |
45 |
140 |
04:25 HRS, 1st |
| Oregon: | ||||||
| North Bend |
25 |
150 |
08:15 HRS, 1st |
43 |
170 |
07:15 HRS, 1st |
| Astoria |
26 |
190 |
14:55 HRS, 1st |
46 |
200 |
14:13 HRS, 1st |
| Medford |
21 |
150 |
06:53 HRS, 1st |
36 |
140 |
06:17 HRS, 1st |
| Eugene |
28 |
140 |
07:54 HRS, 1st |
41 |
160 |
07:51 HRS, 1st |
| Salem |
26 |
180 |
09:56 HRS, 1st |
45 |
170 |
10:09 HRS, 1st |
| Portland |
30 |
190 |
11:55 HRS, 1st |
44 |
170 |
12:17 HRS, 1st |
| Washington: | ||||||
| Quillayute |
26 |
140 |
12:53 HRS, 1st |
51 |
130 |
10:44 HRS, 1st |
| Olympia |
25 |
160 |
15:54 HRS, 1st |
45 |
160 |
15:41 HRS, 1st |
| Sea-Tac |
24 |
180 |
14:56 HRS, 1st |
49 |
190 |
13:04 HRS, 1st |
| Bellingham |
30 |
160 |
18:53 HRS, 1st |
53 |
160 |
18:39 HRS, 1st |
| AVERAGE |
26.2 |
160 |
45.2 |
160 |
||
| [1] Peak wind at Arcata is the last of two occurrences, including out of 130 degrees at 04:53 PST. | ||||||
|
Peak Gusts in the Seattle Area: 01 Jan 2006 Not as Strong as Recent Events Table 5, below, lists Seattle-area peak gusts, in mph, for recent storms. The data reveal that, for the greater Seattle area, the January 1, 2006 windstorm didn't have the punch of some other events in recent memory. The December 27, 2002 cyclone struck much of the area considerably more strongly. And, of course, the January 16, 2000 and March 3, 1999 windstorms are a significant cut above even the December 27, 2002 event. A more recent event on February 4, 2006 also struck the Seattle area with more force than the New Year's storm of '06, but even this one didn't have the punch of event from earlier years. |
| Storm |
Tacoma McChord
|
SeaTac Airport
|
Renton
|
Boeing Field
|
West Point
|
U of W ATG
|
Everett Paine
|
Average
|
| 04FEB2006 |
47
|
47
|
44
|
47
|
66
|
48
|
52
|
50.1
|
| 01JAN2006 |
41
|
49
|
40
|
40
|
54
|
40
|
45
|
44.1
|
| 25DEC2005 |
40
|
38
|
38
|
35
|
48
|
35
|
48
|
40.3
|
| 27DEC2002 |
51
|
52
|
49
|
48
|
59
|
56
|
58
|
53.3
|
| 16JAN2000 |
60
|
52
|
53
|
54
|
69
|
55
|
60
|
57.6
|
| 03MAR1999 |
55
|
60
|
51
|
52
|
68
|
MM
|
57
|
57.2
|
|
Last Modified: February 19, 2006 You can reach Wolf via e-mail by clicking here. | Back | |