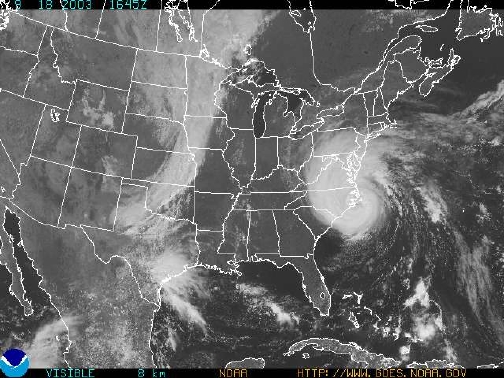
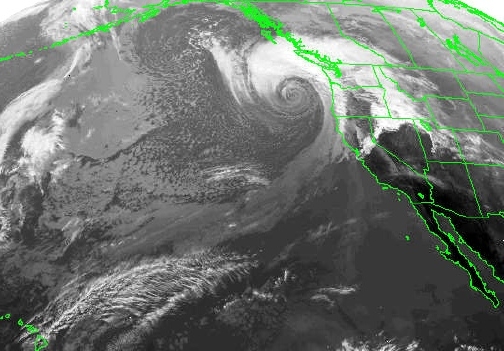
Above, hurricane Isabel, Sep 2003; below, Mar 1999 windstorm.
Eastern Hurricanes
Compared to compiled by Wolf Read |
Above, hurricane Isabel, Sep 2003; below, Mar 1999 windstorm.
|
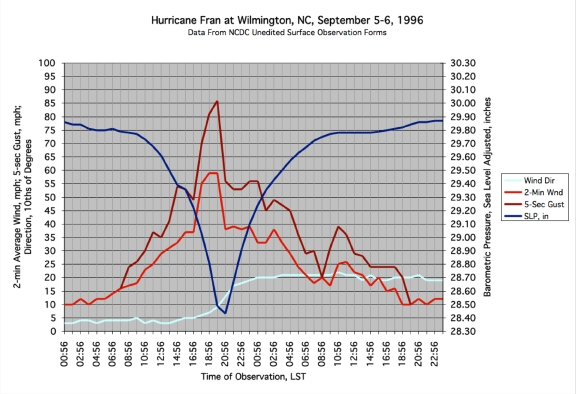
Introduction A hurricane's winds tend to shut down fairly quickly after landfall. Thus, despite some fairly impressive wind speeds during a hurricane's offshore stage, most land areas typically aren't subjected to winds much beyond what a strong midlatitude cyclone can generate. This is particularly interesting in terms of the difference in media attention between Pacific Northwest storms and Eastern hurricanes. Both types of events can produce extreme low pressures and related storm surges, and both types of events seem to generate maximum 2-minute average winds in the range of 50 to 60 mph with 5-second gusts of 70 to 90 in fairly extreme (and rare) cases. Indeed, unofficial gust reports often go higher than this on both coasts, but they aren't different in magnitude. A caveat is required at this point. The above statements generally refer to Category I to III hurricanes on the Saffer-Simpson scale. Low-end category IV storms might also be included, but this needs further examination. Category V hurricanes, such as Andrew in 1992, appear to be something beyond the capability of a midlatitude cyclone. Unfortunately, there aren't any good uninterrupted official observations of Andrew to really examine this in detail. We have to wait for another category V to strike (something I wouldn't wish on any location), and then hope that the ASOS and other official stations will take data without interruption during such an extreme event (a vain expectation, probably). This webpage focuses on the more typical hurricane scenario, the Cat I through IIIs. These hurricanes seem to get much more media attention than the big PNW cyclones, despite little evidence of one or the other being particularly different in their overall strength at urban centers. Perhaps the more typical hurricane is being "overblown" by various news sources, or perhaps PNW midlatitude storms are being underrepresented. That decision will be left to the reader, though I do offer my thoughts at the end of this document. This page will explore the claim that I've made that there's little difference in overall wind impact at land-based sites between the two classes of storms. Storm surge is a different story, mainly because the Pacific and Atlantic coastlines are so different. However, the Pacific Coast isn't without its low-lying areas, and these have been subjected to some major flooding in the past. For example, the Aberdeen-Hoquiam area was deeply inundated by a storm surge during the October 21, 1934 windstorm. Finally, another motivation for doing this kind of comparison is that it offers a chance to explore possible differences between the two kinds of storms. The Wilmington, NC, Meteogram Figure 1, below, shows wind an pressure conditions at Wilmington, NC, for Hurricane Fran, which struck on September 5-6, 1996. Fran was a potent Category III hurricane with a 954 mb center when its eye landed in North Carolina. This will be the model hurricane for comparison to Pacific Northwest windstorms. This graph will be repeated just below meteograms for PNW storms of interest to allow for easy comparison. |
|
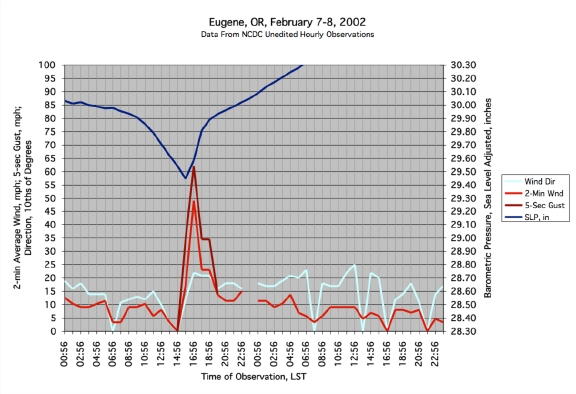
This particular hurricane, and profile, were chosen for a number of reasons. First, Fran struck in 1996, so that Automated Surface Observation Stations (ASOS) were in operation. Wind data between stations and observations are more consistent with ASOS than the manual data collected before ASOS (pre 1993-1996). The storm center passed fairly close to Wilmington, and the resulting winds were quite strong. Out of all the official ASOS and AWOS stations that were affected significantly by Fran, Wilmington shows the fastest speeds. For the record, there was one C-MAN station, Frying Pan Shoals, that indicated significantly higher velocities, with average winds of 91 mph gusting to 124. This data is excluded because it is from an offshore station (many C-MAN stations have been installed on coastlines; these are allowed in this study, for they're land-based, and often near population centers). Land-based measurements--where most people live--will be examined exclusively. PNW storms must produce something quite significant to be comparable to the Wilmington meteogram. With the gustiness of a hurricane, it is easily conceivable that short bursts reached about 100 mph during the 5-second gust of 86 mph that is the official peak at Wilmington, NC. Due to the short time span that ASOS has been around, there's only a limited number of PNW storms that have generated winds worthy of comparison to the Wilmington meteogram. In these terms, it is somewhat unfortunate that the great Columbus Day storm of 1962 didn't wait until 2002. Nevertheless, some interesting wind events have occurred in the PNW since ASOS stations came online, and these are examined below. Eugene, OR, February 7, 2002 Figure 2, below, traces the wind and pressure conditions at Eugene, OR, during a particularly damaging storm on February 7, 2002. The actual peak gust at this site was 70 mph, but this reading was not part of the regular hourly reports, and doesn't show on the meteogram. Hurricane Fran clearly moved the barometer more than the February 7 storm. Of greater significance is that Fran produced high winds (39-mph-plus 2-minute readings, or 58-mph-plus gusts) for a much greater time, about 7 hours verses 1 for 2-minute values. The 2002 storm moved through quickly, with rapidly escalating winds, compared to a more gradual escalation in the case of Fran, though there was a fairly rapid surge as the eye made its closest approach to Wilmington. As will be discussed further, the rapid onset of high winds is a common feature for midlatitude storms in the PNW. Note that the maximum winds during hurricane Fran occurred during the pressure fall phase, whereas the maximum winds during the 2002 storm were during the initial pressure rise phase. This difference is typical. Fran weakened rapidly after landfall; the highest winds at Wilmington occurred as the center neared shore, with a significant portion of the storm still over warm water. Midlatitude cyclones, which aren't as dependent on water temperature as hurricanes, often aren't affected by landfall as significantly as hurricanes. |
|
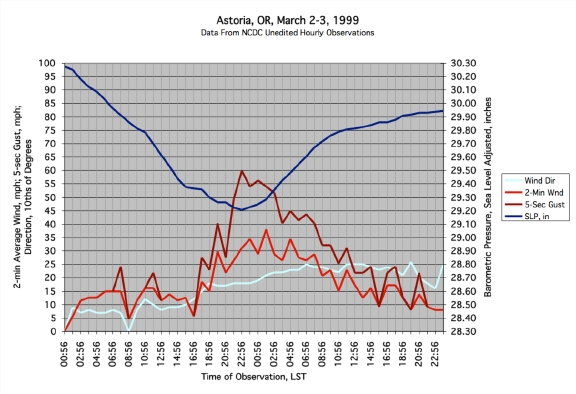
In conclusion, the above two graphs indicate that hurricane Fran was likely a greater threat to life and property when compared to the February 7, 2002 windstorm, mainly due to the duration of high winds, though significantly higher velocities also occurred during Fran: peak 2-minute wind 59 mph vs. 49, and peak gust 86 mph vs. 70. Astoria, OR, March 3, 1999 Figure 3, below, shows the meteorological details at Astoria on March 2nd and 3rd, 1999. Unlike the fast strike of the February 7, 2002 windstorm at Eugene, this event at Astoria resulted in a protracted period of strong wind, with a more gradual escalation. Though pressures fell more deeply on March 3, 1999 verses February 7, 2002, the trace still doesn't match the depth and rapid changes caused by Fran. Wind speeds during the 1999 storm also weren't as strong, with maximum 2-minute readings not quite reaching gale force, and only one observation with a gust in high-wind category. Fran was clearly the more potent of the two events. |
|
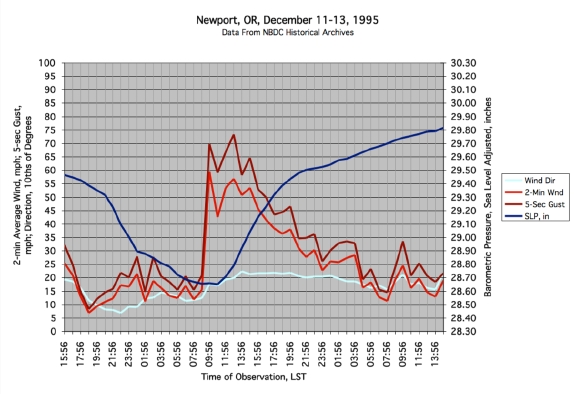
Newport C-MAN Station, OR, December 12, 1995 Figure 4, below, shows the meteorological details at the Newport C-MAN station on December 11th to 13th, 1995. The December 12, 1995 cyclone was a very intense storm with a central pressure that essentially matched hurricane Fran's 954 mb. The 1995 low center passed further away from Newport than Fran did Wilmington, as evidenced by lower pressure at the latter station. Fran produced much faster changes of pressure, especially during the declension phase--that "V" trace is a classic hurricane signature, but it also shows up in PNW storms from time-to-time, such as during the November 3, 1958 windstorm, the Columbus Day storm of 1962 and the November 10, 1975 cyclone. Average winds during the December 12, 1995 windstorm matched those produced by hurricane Fran, though gusts didn't get as high. The difference is likely due to several factors, including the tendency for hurricanes to have very gusty winds, the wind data are from two different types of automated stations, and that the Newport C-MAN station is set up on a coastal jetty where wind is probably less turbulent. The 1995 graph also demonstrates the sudden onset of high winds that's typical for PNW windstorms, an eventuality that contrasts sharply against hurricane Fran. In terms of potential threat to life, a sudden whole gale like the one witnessed on December 12, 1995 might be considered a bigger threat, for there's little visible warning before the wind arrives. Interestingly, the line demarking average wind during the December 1995 storm is very similar in profile, and magnitude, to the devastating wind that befell the Seattle area on October 21, 1934. |
|
So, which storm was more threatening to life and property, December 12, 1995 or hurricane Fran? The distinction isn't so clear cut between these two storms as it was with the others. Both events produced a long period of high winds, with maximum 2-minute average velocities of 59 mph. The only real difference is that hurricane Fran repeatedly produced gusts above 75 mph at Wilmington, as evidenced by the 81 mph and 86 mph peak gusts for two consecutive hourly observations. The December 1995 windstorm tended to yield gusts of 60 to 70 mph, with a peak of 73. Gusts do count, especially when the measure is a 5-second average. Hurricane Fran was likely more punishing; still, the difference isn't as strong as with other storms. Incidentally, the maximum 59 mph average wind at Wilmington isn't considered hurricane force officially; 75 mph or better is required. So, for land-based stations, hurricane Fran wasn't even a Category I hurricane, by definition. Hurricane Fran's highest average winds just before its Cape Fear landfall were 115 mph (hence the Category III ranking). This demonstrates the power of friction-generating topography, and the absence of warm water, in weakening hurricanes. Also, the heavy rain during hurricanes is often cited as contributing to the storm's damage, by saturating soil and weakening trees' footholds. PNW windstorms can produce heavy rain totals as well, and they typically occur in the winter wet season, with soils already saturated by previous storms. The December 12, 1995 windstorm produced some amazing rain totals in Northern California, including 2.66" of rain in 45 minutes at Oakland, and topping off a three-day total of 15.00" in the Russian River drainage. Many stations that end up in the midst of a hurricane might not receive 2.66" of rain for the duration of the storm. |
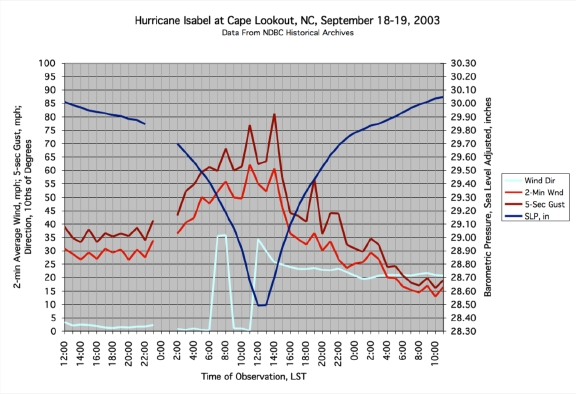
A Brief Catalog of Hurricane Meteograms The Wilmington, NC, meteogram was just one place during one hurricane. There, of course, have been others over the years, and the charts below plot out the wind and pressure record for these events. Unless stated otherwise, these graphs represent stations that reported the strongest winds among ASOS, AWOS and C-MAN systems. Probably the most interesting fact that can be gleaned from this survey is that wind speeds at land-based stations, even those exposed on the coast and barrier islands, rarely reach the official 75 mph average for minimal hurricane force, at least in the hourly data. Ten minute data, which is available for C-MAN stations, reveals some excursions into hurricane territory, but then, so do C-MAN stations for the Pacific Coast during intense midlatitude cyclone events. This is elaborated upon below. Hurricane Isabel, September 17-19, 2003 More than one station is shown for Hurricane Isabel, mainly because the most significant pressure trace wasn't accompanied by the strongest winds, but also to demonstrate that a hurricane generates a wide variety of wind and pressure conditions across an affected region. In other words, the term "hurricane conditions" has a broad meaning in reality. Hurricane Isabel landed near Drum Inlet, NC, as a Category II system with a central pressure of 958 mb and maximum average winds of 104 mph (90 knots). Of course, for many, probably the most memorable moment for this storm was from the mass news coverage when Isabel reached maximum intensity far offshore on Septermber 11, with a minimum central pressure of 915 mb (27.02"!) on September 11th, and average winds of around 230 mph at 4,500 feet as measured by an eyewall dropsonde on September 13th; surface winds would be considerably less, by perhaps 75 percent. Still, 175 mph is quite impressive. Figure 5, below, shows the meteorological details at the Cape Lookout, NC, C-MAN station from September 17th to 19th, 2003. In the hourly data, average wind speeds don't even approach hurricane force even at this very exposed coastal location. Gusts in the range of 77 to 81 mph happened during two observations. A check of the higher-resolution 10-minute data reveals a peak 2-minute wind of 69 mph with a maximum gust of 91 mph at this station. These are punishing values, without a doubt. However, such velocities are not out of the range of PNW windstorms. Indeed, a check of the 10-minute data from the Cape Arago C-MAN station in the Coos Bay area of OR for the February 7, 2002 windstorm reveals a peak 2-minute wind of 75 mph with a maximum gust of 92 mph! A "meager" 994 mb cyclone in the PNW managed to produce category-I-hurricane average-winds, and a higher gust than hurricane Isabel at an exposed, and well-placed coastal NC station!!! Isabel is "considered to be one of the most significant tropical cyclones to affect portions of northeastern North Carolina and east-central Virginia since Hurricane Hazel in 1954 and the Chesapeake-Potomac Hurricane of 1933," according to the National Hurricane Center. Likely the February 7, 2002 windstorm won't be remembered by many after just five or ten years, let alone today. |
|
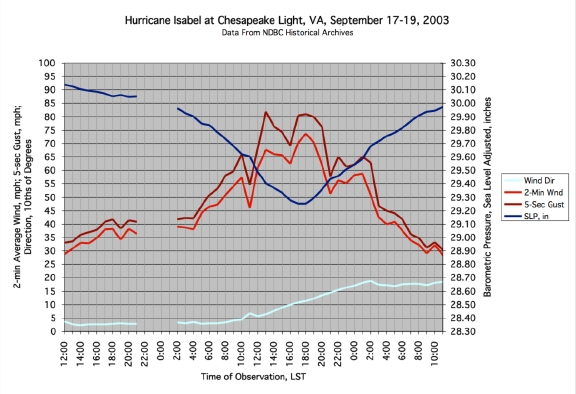
Figure 6, below, shows the meteorological details at the Chesapeake Light, VA, C-MAN station from September 17th to 19th, 2003. Fairly strong high pressure sat over New England as Isabel rolled inland. This resulted in an atmospheric "squeeze play" between high and low pressure: places north of the storm's center ended up under the influence of a very tight pressure gradient. The Chesapeake Light C-MAN station demonstrates the results. These winds were the highest reported from any ASOS, AWOS and C-MAN station for hurricane Isabel, save perhaps the Duck Pier, NC, C-MAN (DUCN7) station which had higher maximum 2-minute winds (by 1-knot), but not as high a peak gust. The pressure trace is not as dramatic as Cape Lookout's, and indeed, appears more like a typical high-wind generating cyclone in the PNW. Average winds were 60 mph or higher for nine consecutive observations (about nine hours)! This represents a major wind event, one that would put significant stress on trees and structures. The 10-minute data reveals a peak 2-minute wind of 75 mph with a peak gust of 95 mph; intense, but also not particularly different than the February 7, 2002 windstorm at Cape Arago, OR. |
|
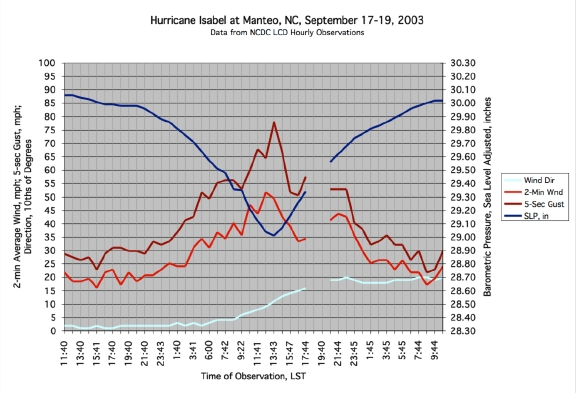
Figure 7, below, shows the meteorological details at the Manteo, NC, AWOS station from September 17th to 19th, 2003. This is a coastal station, probably not quite as exposed as the C-MAN stations. Here, peak 2-minute winds didn't approach hurricane force, but did climb into the whole-gale category. Some gusts were substantial, reaching as high as 78 mph. The pressure tendencies, absolute values, and wind speeds depicted here wouldn't be atypical of a strong windstorm in the PNW. |
|
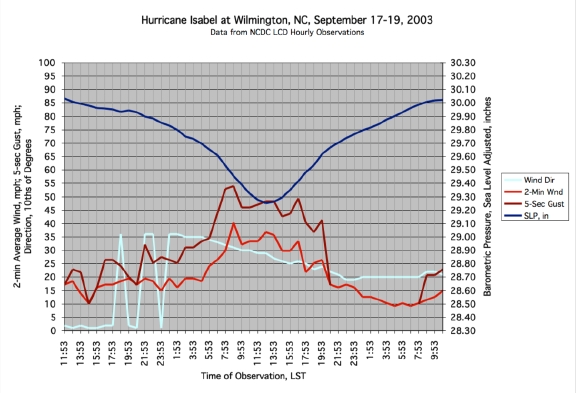
Figure 8, below, shows the meteorological details at the Wilmington, NC, ASOS station from September 17th to 19th, 2003. The results from hurricane Fran are placed below for easy comparison. Isabel's peak 2-minute wind was 45 mph with a peak gust of 59 at Wilmington, a far cry from the 59 mph gusting 86 seven years before. Fran clearly struck closer to Wilmington than Isabel, reflecting on the typically local nature of a hurricane's strongest winds--often much more local than many PNW windstorms, a significant fact in terms of a storm's overall threat to life and property. |
|
Figure 8 is shown next to Figure 4, below. The March 3, 1999 windstorm at Astoria and hurricane Isabel at Wilmington, NC, aren't particularly different in their wind and pressure effects (save for the pattern of wind direction changes). Note that in both these cases, the low centers stayed at least 100 miles from these stations, on tracks that took the storms to the north (SE to NW for Wilmington in 2003 and SW to NE for Astoria in 1999). |
|
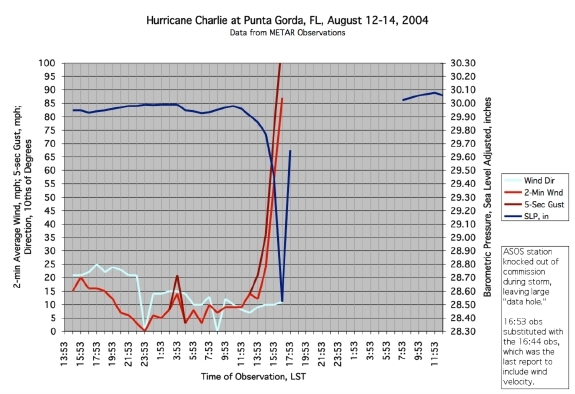
Hurricane Charlie, August 13-15, 2004 Within a week of this webpage going live, hurricane Charlie struck southwest Florida as a Category IV system with maximum average winds of 145 mph and a minimum central pressure of 945 mb (27.91"). At least 19 deaths resulted from this storm, an unfortunate loss. Damage estimates have reached at least $7 billion. This tragic event offers the opportunity to compare a very intense, and compact, category IV hurricane to PNW windstorms. The weight of evidence, I believe, suggests that it is at category IV that hurricanes begin to surpass the potential of midlatitude cyclones in the Pacific Northwest. One caveat to this statement is that Florida, being so flat, and surrounded by a large pool of warm water on three sides, is the ideal location for a hurricane to show its strength. Over Florida, hurricanes don't necessarily degrade as quickly as they do in other states. Figure 9, below, shows the conditions at Punta Gorda, FL, (KPGD), a location that fell under Charlie's eyewall right at landfall--in essence, this place, and Charlotte County in general, was in ground zero of an incredibly potent storm. The effect to the ASOS station was anticipated--the anemometer was destroyed, probably even before peak winds were achieved. The last wind report from Punta Gorda was at 16:44 EDT, with 2-minute average winds of an incredible 87 mph and a 5-second gust to 109. This data suggests brief ("instant") gusts of about 125 mph. This kind of wind is incredibly damaging for just about any lowland region in the United States. Aside from the wind, the pressure trace is also in a very extreme category. Compare that narrow "V" to the results of hurricane Fran and Isabel above. Charlie was a very compact storm, and it moved fairly quickly for a Florida hurricane, at a pace of about 20 mph. The result: a pressure drop of -31.5 mb (-0.93") in less than an hour (15:53 to 16:44 EDT), followed by a pressure surge of +38.3 mb (+1.13") in a little more than an hour (16:44 to 17:53 EDT). Likely, these figures don't contain the lowest sea-level pressure reading at Punta Gorda, for the pressure was changing so quickly that even the special reports probably missed the actual minimum. Rates of change approached 1.0 mb (0.03") a minute! As far as I have seen, no PNW windstorm has even approached the magnitude of pressure tendency shown by hurricane Charlie. The November 10, 1975 southwest Oregon windstorm produced hourly tendencies of -7.7 mb (-0.23") and +16.6 mb (+0.49"), the strongest known. |
|
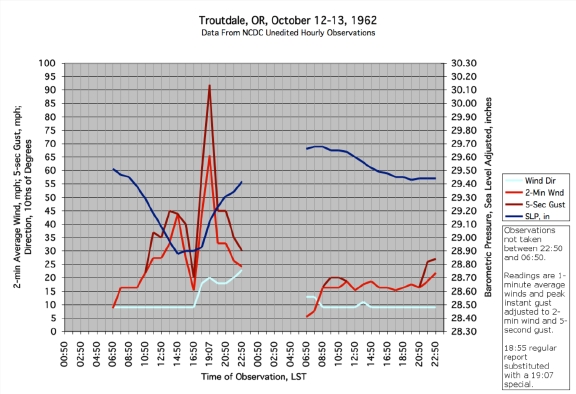
Figure 10, below, shows conditions at Troutdale, OR, during the great Columbus Day storm of 1962, the Pacific Northwest's main challenge for category IV Florida hurricanes. I've been trying to limit this webpage to ASOS data. I've made an exception in this one case, just to reveal the magnitude of the storm of 1962. The wind data depicted below has been adjusted to modern 2-minute-wind and 5-second-gust values, via a 1.05 and 1.15 conversion (1-minute-wind / 1.05, and instant-gust / 1.15 respectively). The peak instant gust at Troutdale was 106 mph--not the strongest gust measured in the storm of '62, but one of the highest readings from a station that took consistent hourly records. Hurricane Charlie, at Punta Gorda, is nevertheless the stronger of these two events/locations. It is interesting to consider, however, that at Corvallis, OR, gusts reached 127 mph during the Columbus Day storm when the anemometer was destroyed, an event that reportedly happened before the tempest's peak. This is very similar to the estimated instant gust of 125 mph for Punta Gorda before the ASOS station was put out of commission! So a category IV in Florida is above most PNW windstorms, save possibly one. Willamette Valley residents should keep the level of destruction to southwest Florida in mind when considering the potential for wind damage in Oregon. |
|
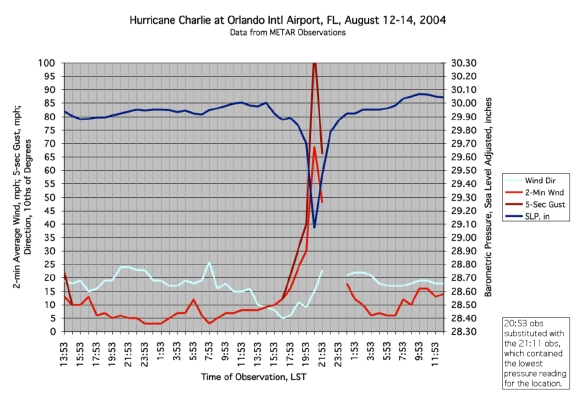
Before moving on to more Charlie meteograms, here are official NWS notes from Salem, OR, after the Columbus Day storm (from the comments section on WBAN form 10-B): "Numerous buildings blown apart at airport. Public reports multitude of trees blown over--flying glass and down power lines. Two or three small aircraft turned over and partially destroyed." Sounds quite a bit like the results of hurricane Charlie at Punta Gorda! Figure 11, below, shows Charlie's effects at the Orlando International Airport, FL (KMCS). The hurricane had lost some of its steam as it moved inland, but still packed quite a wallop at Orlando. The pressure trace is still quite extreme, with a -21.3 mb (-0.63") drop in about an hour (19:53 to 21:11 EDT) and a subsequent jump of +13.5 mb (+0.40") also in about an hour (21:11 to 21:53 EDT). These values are nevertheless quite short of the extremes witnessed at Punta Gorda. Peak 2-minute winds at Orlando reached 77 mph, true hurricane status, with a maximum gust of 105 mph. Winds at Orlando outclass the Columbus Day storm at Troutdale, but the magnitude of difference is less than with Punta Gorda. Indeed, the ASOS station managed to get through the hurricane with only two hours of wind data missing after the peak of the storm. Judging by the relatively gradual shift in wind direction, the exact center of hurricane Charlie passed north of this station, but the eye was nevertheless quite close. |
|
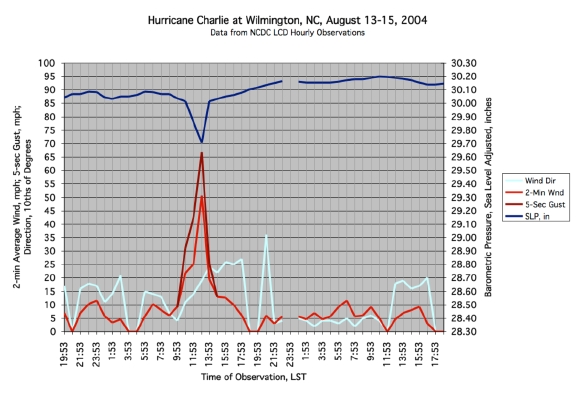
Figure 12, below, returns the reader to Wilmington, NC (KILM). Hurricane Charlie pulled across the Florida peninsula relatively intact, and entered the Atlantic Ocean near Daytona Beach. Continuing on a northeast track, the storm eventually landed in the Carolinas as a category I system. The center passed fairly close to Wilmington. Charlie marked the third close passage of a hurricane (close enough for high-wind-criteria gusts) since 1996! Fast pressure changes were still evident at Wilmington, but the magnitude of swing was considerably less than that witnessed in Florida. Wind speeds were considerably less, too, but still swept through the community at damaging levels. The peak 5-second gust reported at the station was 74 mph (outside the hourly observations). This meteogram is remarkably similar to conditions experienced at Eugene on February 7, 2002: Eugene's meteogram is reproduced below for convenience. Pressure swings were similar in scope, though the February storm was deeper. Eugene's peak 5-second gust, to reiterate from far above, was 70 mph, fairly close to Wilmington's 74 mph from Charlie. Again, it seems that PNW windstorms do match the results hurricanes, in this case the effects of a category I system. |
|
Just for convenience, the three meteograms for Wilmington, NC, are stacked below. Data from the same location reveals how unique the effects between different hurricanes can be. Fran, Isabel and Charlie were all unique storms. This uniqueness also shows up during PNW windstorms. No two events are exactly alike, making generalizations somewhat difficult. |
|
Hurricanes Vs. Extratropical Cyclones: Some Thoughts Admittedly, this is a brief examination, of which I hope to add more information as time permits. From available land-based data, the winds from landfalling hurricanes at category II and III often aren't much stronger than those created by strong midlatitude cyclones that affect the PNW. At some coastal stations, wind speeds sometimes gust higher than significant windstorms in recent PNW history, but not always, as evidenced by the February 7, 2002 windstorm at Cape Arago and the Columbus Day storm in general. So, why all the hype about eastern hurricanes, such as Alex in 2004 which at best only grazed North Carolina, with little attention to a strong PNW cyclone? Minimum sea-level pressures aren't any different between the strong PNW cyclone events and category II and III hurricanes, and average wind speeds, as measured on the coast, can match the tropical storms. Storm surge potential is likely not significantly different between the two types of storms. Population is higher on the storm-surge prone sections of the Eastern Seaboard when compared to the Pacific Coast; however, this distinction is rapidly diminishing as people continue to add homes to the scenic West Coast. Differences in coastal morphology have been mentioned--but this distinction does not apply to everywhere, as evidenced by major storm-surge flooding along the Pacific Coast during the October 21, 1934 windstorm, among others. Some might argue that a hurricane's potential for destruction is higher as indicated by the high wind, and very low pressure readings, that typically occur far offshore. However, as shown by Isabel, strong hurricanes don't tend to sustain high levels for very long. Of course, Isabel was category III; not the most powerful kind of hurricane around. As evidenced by history, landfalling category V hurricanes are very rare events and their strength is also sapped fairly quickly after landfall. Only three cat-V's occurred in the United States during the 20th century: the Labor Day hurricane of 1935, hurricane Camille in 1969, and hurricane Andrew in 1992. Two of these occurred in Florida, and Camille struck the central Gulf Coast. Perhaps these rare category V's should be treated differently, a separate class of highly-destructive hurricane. Also, when arguing potential, major PNW windstorms must also be considered. The 1962 Columbus Day storm provides a measure of a Pacific cyclone's potential: this was an event that almost certainly outclassed Fran. No hurricane in history, no matter how strong, managed to knock down as much forest as the great gale of 1962. The land area strongly affected by the Columbus Day storm, well over 75,000 square miles, is only rarely equaled by a hurricane (Hazel of 1954 may fit in this category). Wind speed estimates put gusts of 180 mph or more on parts of the Oregon coast--this is a match for Andrew, who's fastest land-based winds were also measured at restricted coastal locations in Florida. Hurricanes have a bad name. Some have been highly destructive to life and property, such as Galveston in 1900, the Florida Keys in 1935, and New England in 1938. This memory lives on. This is probably why hurricanes receive more attention than Pacific Coast storms. But is such dramatic attention to category I, III and III hurricanes necessary during these days of modern forecasting? Deaths by storm surge, often cited as the deadliest aspect of a hurricane, have been so reduced by warnings and evacuations that wind velocity is now becoming the more significant threat. With a hurricane's main weapon reduced in potency (admittedly by all the attention), and population growing on Pacific shores, the difference in threat between hurricanes and Pacific cyclones appears to be approaching equalization. Perhaps, in the final analysis, PNW storms should receive more media attention (respect) than they typically get. |
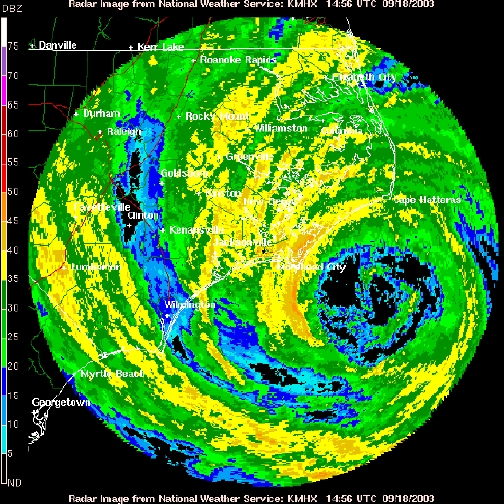
Below, Doppler
radar view of hurricane Isabel's eye as the storm neared North Carolina's
shoreline.
The eyewall,
the region where a hurricane's strongest wind is typically located,
is quite visible around the nearly rain-free center. |
Last Modified: August 23, 2004 You can reach Wolf via e-mail by clicking here. | Back | |