The February 13, 1979 Windstorm compiled by Wolf Read |
|
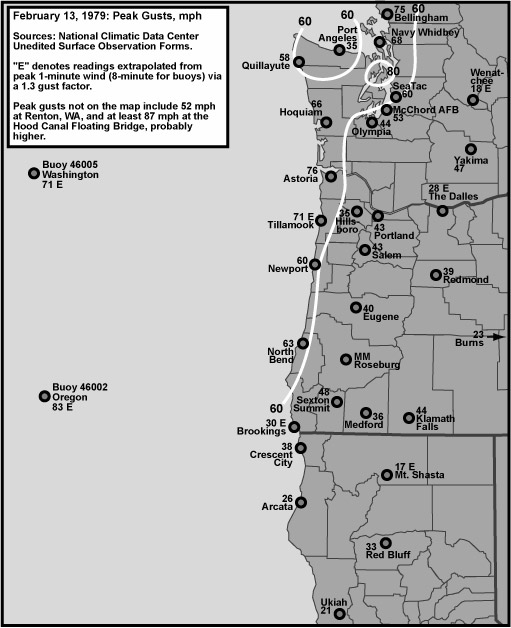
In the early morning of February 13, 1979, as average winds exceeded 80 mph (and perhaps even reached 105 mph), the Hood Canal Floating Bridge finally succumbed to one of the greatest storms to strike the upper Kitsap region. The force of wind and wave fored the bridge into a list that exposed the pontoon's access hatches to the water's hammer blows--at least in theory. The hatches were sheared off. Water entered the pontoons, and a section of the bridge's west end went down. At some point, a length broke free and floated northward up the canal before finally sinking. These are the fragments that I recall from a report on the bridge's failure that I read in 1987. Memory being the imperfect thing that it is, I wouldn't count on the veracity of this account. If you've got the better knowledge, and perhaps a reference, feel free to contact me. The span remained closed for 3.5 years, and replacement of the lost section cost about $143 million in 1982 dollars [1]. The February 13, 1979 windstorm was certainly an expensive one! Study of the NCDC's February 1979 Storm Data reveals little more about the storm. There's nothing listed for Washington. A tragedy. This event happened to be one of the classic "Seattle windstorms," where a lee low developed east of the Olympic Mountains and enhanced the pressure gradient over the Puget Sound region. For the 1979 storm, the gradient was especially strong from about Sea-Tac northward. The peak gust distribution reflects this: 44 mph at Olympia, 53 at Tacoma, 60 at Sea-Tac, and very much faster in the Hood Canal. A recent example of this kind of lee troughing occurred with the December 27, 2002 minor windstorm. According to data from Buoy 46005, 315 nautical miles west of Aberdeen, WA, the February 13, 1979 cyclone was at least a 968 mb (28.58") low, perhaps a bit deeper. The storm's center actually passed a bit south of this station. Apparently, the low started to fill as it moved inland on Vancouver Island. As the center passed just south of Tofino, the station's minimum pressure reached 974 mb (28.76"), and as it passed north of Comox, this station showed a minimum of 975.8 mb (28.82"). This cyclone wasn't in a hurry, and as a result of its casual motion, the high wind period at many locations, especially in Washington, lasted for many hours. Wind gusts of 30 mph and more continued for 10 hours at Sea-Tac, and at Astoria, gusts of 40 mph or more occurred for a period of 11 hours. The long duration of strong winds made this storm particularly damaging, especially along the Olympic Peninsula. |
February 13, 1979: Some Meteorological Details |
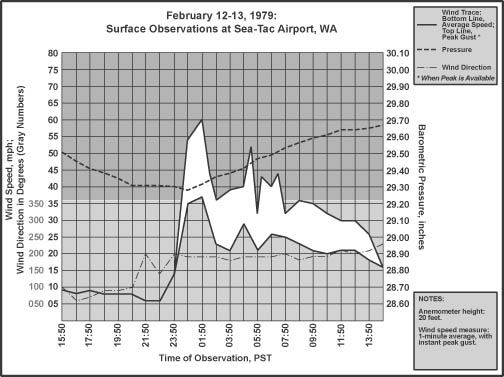
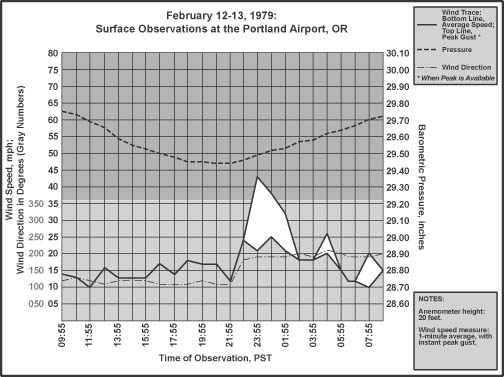
Examination of Interior Stations Wind and pressure conditions are plotted for Sea-Tac and Portland in Figures 1 and 2, below. High winds at Seattle were much stronger, and of longer duration, that at Portland, a reflection of the lee low that set up east of the Olympics and enhanced local gradients. Other conditions, such as wind direction and pressure tendency, were similar between the stations, the mark of a cyclone passing to the north of both stations. Source: Hourly data are from the National Climatic Data Center, unedited surface observation forms. |
|
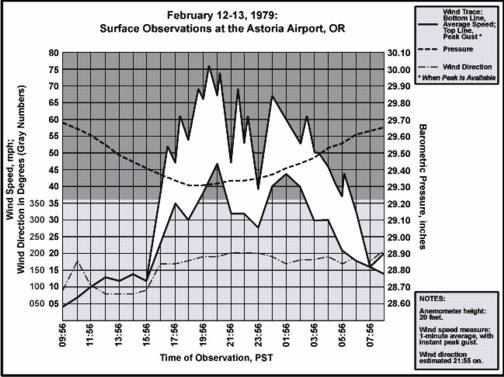
Examination of Some Coastal Stations Wind and pressure conditions are plotted for Astoria in Figure 3, below. The graph demonstrates the long period of damaging winds that occurred at coastal stations. Places further north, like Hoquiam and Quillayute, do not look too different. Astoria suffered several wind gusts above 65 mph, and a protracted time of bursts of high wind criteria, 58 mph and above. This ranks as one of the more significant gales for the region. Source: Hourly data are from the National Climatic Data Center, unedited surface observation forms. |
|
General Storm Data Table 1, below, lists the barometric minimums for the February 13, 1979 storm at selected sites. Many Pacific Northwest windstorms have produced lower readings in the region. As mentioned in the introduction, the most depressed pressures during this storm were on Vancouver Island, where the low made landfall.Of interest is the long period of time that barometers stayed around their minimums, as indicated in the notes section. This is a reflection of not only a big low, but also one that moved fairly slowly. Source: Hourly data are from the National Climatic Data Center, unedited surface observation forms. |
Table 1 Notes: [1] Last of two hourly reports in a row with the same reading. [2] Last of four hourly reports in a row with the same reading. [3] Last of three hourly reports in a row with the same reading. [4] Last of two hourly reports in a row with the same reading. [5] Last of two hourly reports in a row with the same reading. |
Table 2, below, lists the maximum gradients for some standard measures during the February 13, 1979 cyclone. These gradients are strong, but not particularly so. In fact, storms producing at least +4.2 mb (0.12") for EUG-PDX aren't that uncommon during a typical winter.These gradients likely refelct the track of the storm, which was fairly far north for a high-wind event. For reference, the maximum PDX-BLI gradient was +15.0 mb (0.44") at 05:00 on the 13th, and the maximum ACV-UIL gradient was +26.3 mb (0.78") at 01:00 and 02:00 on the 13th. Source: Hourly data are from the National Climatic Data Center, unedited surface observation forms. |
Table 2 Notes: [1] Last of two occurences. |
A key measure for storms that track across the Olympic Peninsula and/or South Vancouver Island is the PDX-BLI gradient. Table 3, below, ranks a number of memorable, and not-so-memorable, storms by this measure. The February 13, 1979 windstorm ranks about 9th on this table, not a bad showing. Sources: National Weather Service, Eureka, Portland and Seattle offices, METAR reports, and the National Climatic Data Center, unedited surface observation forms (for historical storm pressure data). |
| |||||||||||||||||||||||||||||||||||||||||||||||||||||||||
Pressure Tendencies The February 13, 1979 windstorm brought with it a modest "pressure couplet" over much of Western Oregon and Washington. Strong pressure surges (+3.0 mb and higher) were limited to the far northern stations. Table 4, below, shows the maximum hourly changes in pressure for eleven key stations in the Pacific Northwest. These pressure tendencies are among the weakest for any significant windstorm since 1948. Part of this has to do with the low's distance north, and another part has to do with the storm's slow progress. This is a reminder that barometers might not show unusually fast falls ahead of every high-wind-producing cyclone. Source: Microfilm copies of the unedited surface observation forms, obtained from the National Climatic Data Center. |
|
||||||||||||||||||||||||||||||||||||||||||||||||||||||||||||||||||||||||||||||||||||||||||
Table 4 Notes: [1] The +1.4 mb hourly rise at Artcata is the last of two occurrences, the other instance having occurred at 19:00. [2] The -1.7 mb hourly fall at North Bend is the last of two occurrences, the other instance having occurred at 11:00. [3] The -2.0 mb hourly fall at Astoria is the last of two occurrences, the other instance having occurred at 13:00. [4] The +1.2 mb hourly rise at Salem is the last of two occurrences, the other instance having occurred at 19:00. |
Table 5, below, lists the peak wind and gust for eleven key stations in the Pacific Northwest, their direction, and their time of occurrence. "Peak Wind" is a 1-minute average, and "Peak Gust" is an instant reading. By my own personal methodology, a wind event rates the term "windstorm" when the average peak gust of these eleven stations reaches 39.0 mph (gale force) or higher. The February 13, 1979 windstorm exceeded this value by a large margin, and made it well into moderate windstorm category. Moderate windstorms have an average of 45.0 to 54.9, and major windstorms are those that reach or exceed 55.0. Only a handfull of storms have made the majors, including December 12, 1995, November 14, 1981 and October 12, 1962. Source: Hourly data are from the National Climatic Data Center, unedited surface observation forms. |
| Location | Peak |
Direction |
Obs Time of |
Peak |
Direction |
Obs Time of |
| California: | ||||||
| Arcata | 23 |
150 |
17:53 HRS, 12th |
26 |
180 |
09:57 HRS, 12th |
| Oregon: | ||||||
| North Bend | 40 |
200 |
19:50 HRS, 12th |
63 |
200 |
18:55 HRS, 12th |
| Astoria | 47 |
190 |
20:56 HRS, 12th |
76 |
180 |
20:18 HRS, 12th |
| Medford | 21 |
170 |
15:57 HRS, 12th |
36 |
180 |
15:34 HRS, 12th |
| Eugene | 25 |
210 |
23:55 HRS, 12th |
40 |
180 |
21:27 HRS, 12th |
| Salem | 30 |
190 |
22:55 HRS, 27th |
43 |
190 |
22:40 HRS, 12th |
| Portland | 25 |
190 |
00:55 HRS, 13th |
43 |
190 |
23:42 HRS, 12th |
| Washington: | ||||||
| Quillayute [1] | 29 |
160 |
02:58 HRS, 13th |
58 |
160 |
02:58 HRS, 13th |
| Olympia | 29 |
190 |
02:55 HRS, 13th |
44 |
210 |
05:10 HRS, 13th |
| Sea-Tac | 37 |
190 |
01:50 HRS, 13th |
60 |
190 |
01:46 HRS, 13th |
| Bellingham | 38 |
160 |
04:56 HRS, 13th |
75 |
170 |
04:04 HRS, 13th |
| AVERAGE | 31.3 |
182 |
51.3 |
185 |
Table 5 Notes: [1] Readings are estimated, and could very well be low. Peak winds at nearby Hoquiam were 46 mph out of 190 degrees 21:53 PST on the 12th with a peak gust of 66 mph out of 180 degrees at 00:37 PST on the 13th. |
References [1] Replacement cost, and other details, for the Hood Canal Floating Bridge was obtained from the Washington State Department of Transportation web page, "Hood Canal Bridge History." |
Last Modified: February 20, 2004 You can reach Wolf via e-mail by clicking here. | Back | |