The December 15, 1977 Windstorm compiled by Wolf Read |
|
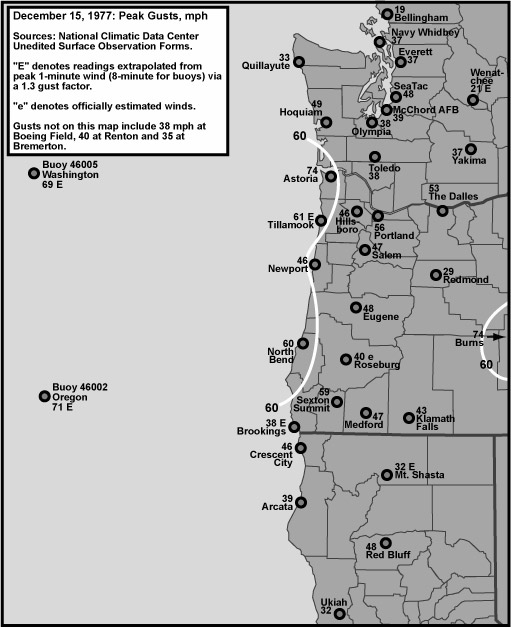
In the late night of December 14th and into the morning of the 15th, 1977, strong winds blew through Northwest California, across much of Oregon and into Southwest Washington as an intense low moved ashore near Hoquiam and into the Puget Lowlands. Based on pressure observations at Hoquiam, this cyclone had a central pressure of at least 982 mb at landfall--a fairly powerful storm. The low appears to have been deepening all the way to landfall: at 17:00 on the 14th, buoy 46002, some 300 miles off of Southwest Oregon, showed a pressure of 988.7 mb (a strong pressure surge of 8.5 mb/hr one-hour after this minimum indicates that the low center passed very close to this station), and buoy 46005, about 300 miles off of Southwest Washington, showed 985.0 mb at 22:00 on the same day. Despite the storm's strength, most interior sections were spared high wind criteria gusts (58 mph or more)--the coast was reserved for this special treatment. This cyclone brought with it thunderstorms. Weather observers at Arcata, Brookings, Sexton Summit (with snow!) and Roseburg all noted lightning during the nighttime hours. Though Washington was generally spared the strong wind assault that befell Oregon, a different attack struck the Puget Sound area: record high tides [1]. As the cyclone swept inland, minimum barometric pressure coincided with high tide in the Sound region.The combination left the Puget Sound deeper than any previous record at some tide gauges, including a 14.8 foot maximum in Elliott Bay (14.6 feet was the old record from December 5, 1967) and 15.7 feet in Poulsbo's Liberty Bay (old record 15.5 feet). Damage to waterfront property, which included flooded buildings, basements and broken seawalls, occurred from Olympia to Comano Island. |
General Storm Data Table 1, below, lists the barometric minimums for the December 15, 1977 storm at selected sites. Barometers over Northwest Oregon and Western Washington indicated quite low readings, but a number of Pacific Northwest windstorms have produced lower values. Of interest is the long period of time that barometers stayed around their minimums, as indicated in the notes section. This is a reflection of not only a fairly broad low, but also one that moved fairly slowly. The unusually high tides were likely exacerbated by the long period of low pressure over Washington. Source: Hourly data are from the National Climatic Data Center, unedited surface observation forms. |
Table 1 Notes: [1] Last of two hourly reports in a row with the same reading. [2] Last of two hourly reports in a row with the same reading. [3] Last of two hourly reports in a row with the same reading. [4] Last of two hourly reports in a row with the same reading. [5] Last of three hourly reports in a row with the same reading. [6] Last of three hourly reports in a row with the same reading. |
Table 2, below, lists the maximum gradients for some standard measures during the December 15, 1977 cyclone. Gradients south of the low's track were quite strong. Double-digit measures (ahead of the decimal) for EUG-PDX and PDX-SEA are rare, and quite respectable. Any measure of +30.0 mb (+0.89") or higher is major. This storm was definitely not lacking in the extreme gradient department! Source: Hourly data are from the National Climatic Data Center, unedited surface observation forms. |
Table 2 Notes: [1] Max negative gradient -1.9 mb at 01:00 on the 15th. [2] Max negative gradient -1.1 mb at 23:00 on the 14th. [3] Max negative gradient -1.8 mb at 05:00 on the 15th. [4] Max positive gradient +4.5 mb at 16:00 on the 15th. |
A key measure for storms that track across the Olympic Peninsula and/or South Vancouver Island is the PDX-BLI gradient. Though the December 15, 1977 storm came in just south of the Olympics, I've included it in Table 3, below. The 1977 windstorm ranks about 11th on this incomplete table. Sources: National Weather Service, Eureka, Portland and Seattle offices, METAR reports, and the National Climatic Data Center, unedited surface observation forms (for historical storm pressure data). |
| |||||||||||||||||||||||||||||||||||||||||||||||||||||||||
Pressure Tendencies The December 15, 1977 windstorm brought with it a decent "pressure couplet" over much of Western Oregon and Washington. Strong pressure surges (+3.0 mb and higher) were occurred from about North Bend to Salem and northward. Table 4, below, shows the maximum hourly changes in pressure for eleven key stations in the Pacific Northwest. Though this storm made barometers move with some vigor, these values are representative of the typical results from a good high-wind generating cyclone. No records were broken on December 14-15, 1977. This doesn't mean the numbers are weak--they just don't stand out against the major storms of history, such as Columbus Day 1962. Of interest is a double pressure surge that showed up at a number of stations, after the low had passed. Figure 1, below the table, plots hourly pressure tendency in millibars against the hourly pressure readings in inches for Salem, OR. The two spikes in the hourly pressure tendency show up well. Apparently, the first surge marked the passage of a moderately-defined cold front where temeprature and dew point fell about 5 and 10 degrees F respectively, and the second surge the passage of the upper trough, or, likely for places a bit further north, a strong bent-back occlusion in association with the upper trough. A similar plot for Astoria is provided in Figure 2, below. For Astoria, the second surge was the strongest, and at +5.8 mb/hr (0.17"), is noteworthy. West gusts in excess of 70 mph accompanied that strong pressure jump--the mark of an intense bent-back occlusion. Source: Microfilm copies of the unedited surface observation forms, obtained from the National Climatic Data Center. |
|
||||||||||||||||||||||||||||||||||||||||||||||||||||||||||||||||||||||||||||||||||||||||||
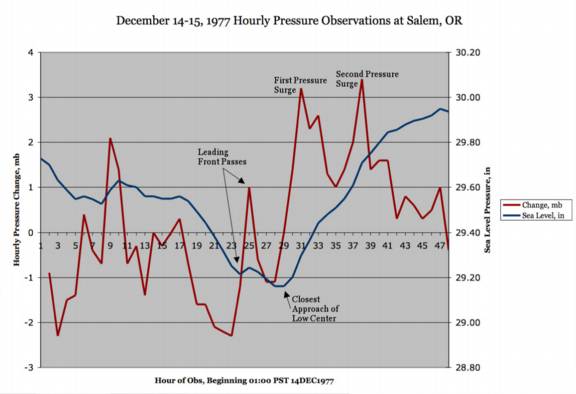
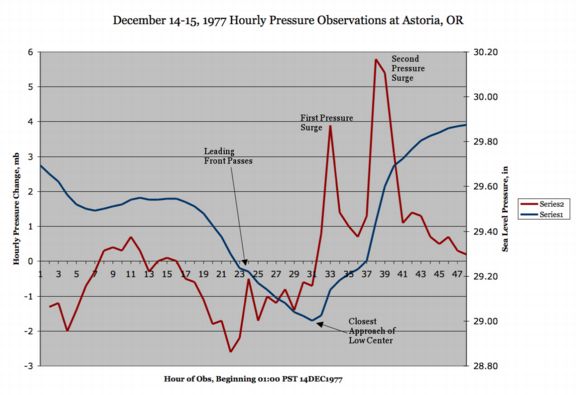
Table 4 Notes: [1] The -2.4 mb hourly fall at Artcata is the last of two occurrences, the other instance having occurred at 12:00. [2] The +3.4 mb hourly rise at Portland is the last of two occurrences, the other instance having occurred at 09:00. See text above for more details on this double pressure surge. |
Table 5, below, lists the peak wind and gust for eleven key stations in the Pacific Northwest, their direction, and their time of occurrence. "Peak Wind" is a 1-minute average, and "Peak Gust" is an instant reading. By my own personal methodology, a wind event rates the term "windstorm" when the average peak gust of these eleven stations reaches 39.0 mph (gale force) or higher. The December 15, 1977 windstorm surpassed this threshold, and just made it into moderate windstorm category. Moderate windstorms have an average of 45.0 to 54.9, and major windstorms are those that reach or exceed 55.0. Only a handful of storms have made the majors, including December 12, 1995, November 14, 1981 and October 12, 1962. Of interest was the particularly strong winds associated with the cyclone's bent-back occlusion, as indicated by the major west winds at Astoria. With the bent-back trailing the low, this explains the much later timing of peak winds at Astoria when compared to other Oregon stations. Hoquiam also felt the bent-back occlusion, with maximum winds of west 32 mph gusting 45 at 15:55 on the 15th, with a peak gust of 49 at 15:35. Arguably, Sea-Tac was also pounced by the bent-back, with the late arrival of the winds in that region, though they lacked the strong westerly component seen at Hoquiam and Astoria. Source: Hourly data are from the National Climatic Data Center, unedited surface observation forms. |
| Location | Peak |
Direction |
Obs Time of |
Peak |
Direction |
Obs Time of |
| California: | ||||||
| Arcata | 25 |
220 |
21:27 HRS, 14th |
39 |
230 |
22:21 HRS, 14th |
| Oregon: | ||||||
| North Bend | 31 |
240 |
03:55 HRS, 15th |
60 |
210 |
03:08 HRS, 15th |
| Astoria | 39 |
270 |
13:55 HRS, 15th |
74 |
270 |
13:23 HRS, 15th |
| Medford | 32 |
220 |
00:15 HRS, 15th |
47 |
220 |
00:27 HRS, 15th |
| Eugene | 32 |
220 |
05:55 HRS, 15th |
48 |
210 |
06:02 HRS, 15th |
| Salem [1] | 29 |
170 |
11:55 HRS, 15th |
47 |
170 |
10:17 HRS, 15th |
| Portland | 35 |
210 |
07:55 HRS, 15th |
56 |
200 |
06:33 HRS, 15th |
| Washington: | ||||||
| Quillayute | 18 |
280 |
18:56 HRS, 15th |
33 |
280 |
14:41 HRS, 15th |
| Olympia [2] | 25 |
180 |
13:55 HRS, 15th |
38 |
180 |
10:09 HRS, 15th |
| Sea-Tac | 35 |
200 |
19:29 HRS, 15th |
48 |
210 |
19:32 HRS, 15th |
| Bellingham [3] | 15 |
200 |
22:53 HRS, 15th |
19 |
200 |
22:53 HRS, 15th |
| AVERAGE | 28.7 |
219 |
46.3 |
216 |
Table 5 Notes: [1] Peak wind is last of three occurrences, with the other two happening at 04:55 and 10:55 on the 15th. [2] Peak gust is the last of two occurrences, with the other happening at 09:44 PST. [3] Peak wind is last of two occurrences, with the other happening at 12:58 out of 180 degrees. Peak gust estimated from peak wind via a standard 1.3 gust factor. |
References [1] High tide reported in NCDC's Storm Data publication for December 1977. |
Last Modified: February 26, 2004 You can reach Wolf via e-mail by clicking here. | Back | |