The Major Sou'wester of December 4, 1945 compiled by Wolf Read |
|
Like December 21, 1940, December 5, 1945 witnessed the arrival of a "classic" sou'wester, one of a family of storms that includes the "Big Three": Columbus Day 1962, November 13-14, 1981 and December 12, 1995. Big Three is a meaningful distinction--this rarefied category encompasses those classic events that had truly disastrous impact on the West Coast, usually from about the San Francisco Bay Area northward. It appears that the December 5, 1945 windstorm was at the Big Three level. Its affect on the Bay Area was not as pronounced as during other big events, such as December 12, 1995, but gusts still reached 47 mph at San Francisco, with a period of heavy rain. Northward, this storm has all the hallmarks of a truly big event, including gusts over 70 mph in the Willamette Valley, 60 to 70 mph in the Puget Lowlands, and gusts in excess of 80 mph along the Oregon and Washington coast. In typical fashion, Eugene had slower winds than places north in the Willamette Valley, and Sea-Tac Airport had the most plodding winds in Western Washington. With this pattern in place--strongly so--for the 1945 storm, it seems that the Big Three might have to be upgraded to Big Four. The National Climatic Data Center's Climatological Data for December 1945, Oregon Section, mentioned the windstorm after a summary on a large flood on the 27th-28th: "The severe windstorm on December 4th, also, caused considerable destruction of property. Some localities, especially those in western Oregon, were without electricity and telephone service for several days. Some unroofing of building was reported to have occurred in some of the more exposed places." The comments from the Washington Climatological Data for December 1945 were less inspired, but reflect the basic pattern of the big classic events (western Oregon usually gets the brunt): "Winds attained their greatest velocities on the coast on the 4th, when the highest velocity at Tatoosh Island was recorded at 64 miles per hour from the southwest and North Head had 62 m.p.h., also from the southwest. These velocities are much less than previous records for these stations." Like the sou'wester of December 21, 1940, the December 4, 1945 storm has the distinction of being quite a warm one (for December, anyway!). Many places in western Washington and Oregon, monthly temperature highs occurred during this windstorm, typically in the period of high winds--prefrontal southerlies. Places south don't necessarily show this feature, which was strong everywhere during the 1940 storm. Medford's temperature hardly changed as the winds tore through the Rogue Valley, hovering around the mid-to-upper 40s. Arcata, California, showed little temperature change as well, with values from the low-to-mid 50s. This contrasts strongly against Portland, who's temperature climbed from 51 F at 08:25 PST to 64 F by 13:25, with south winds up to 34 mph at that end time. After a wind shift to SSW around 15:26 PST, Portland's temperature would fall to 48 F by 17:25. Seattle's temperature would climb to 60 F around 14:00 to 15:00 (59 F at 14:25), with the arrival of the storm's south winds, and at Port Townsend, the air temperature elevated to 54 F by 16:20, when the south surge hit. Compared to the 1940 storm, these escalations aren't as spectacular, for they generally occurred during the day, and diurnal heating likely played a role in the magnitude of the changes, especially for Portland and Seattle. |
General Storm Data Table 1, below, lists the barometric minimums for the December 4, 1945 storm at selected sites. Compared to the Big Three, this windstorm falls short. The Columbus Day storm produced an average minimum pressure of 28.84", the November 13-14, 1981 windstorm reached 29.00" for an average minimum, and December 12, 1995 averaged an incredible 28.69". However, 29.19" is a good showing, and reflects a potent cyclone. The Big Three were all sub-960 mb storms. Judging by the minimum pressures below, and the low's proximity to the coastline, the December 4, 1945 windstorm didn't reach this level of intensity. Perhaps, it was a 975 mb system at its strongest. This might be reason to keep the 1945 storm out of the Big Three category, though its wind speeds tell a different story. Source: Hourly data are from the National Climatic Data Center, unedited surface observation forms. |
Table 1 Notes: [1] Last of three hourly reports in a row with the same reading. [2] Last of two hourly reports in a row with the same reading. |
Figure 1, below, shows active barometers for coastal stations. A fairly strong storm preceded the main event, a situation that isn't uncommon among the big sou'westers--the Columbus Day storm followed closely on the heels of a cyclone, and November 14, 1981 was preceded by a fairly potent storm on the 15th. To state the obvious, the charts show a trend of lower readings northward, which suggests that the storm may have had a more northeast track like December 12, 1995, or the 1945 low continued deepening as it headed northward, or a combination of both. Source: Hourly data are from the National Climatic Data Center, unedited surface observation forms. |
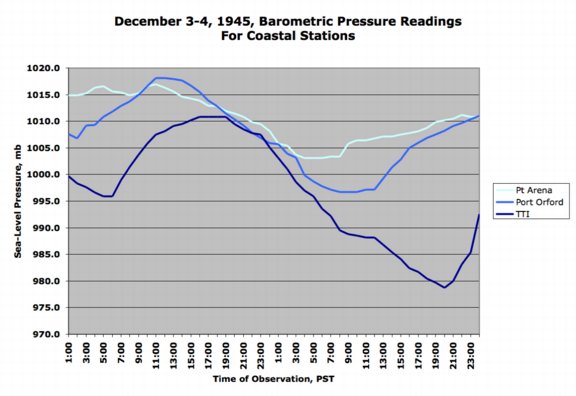
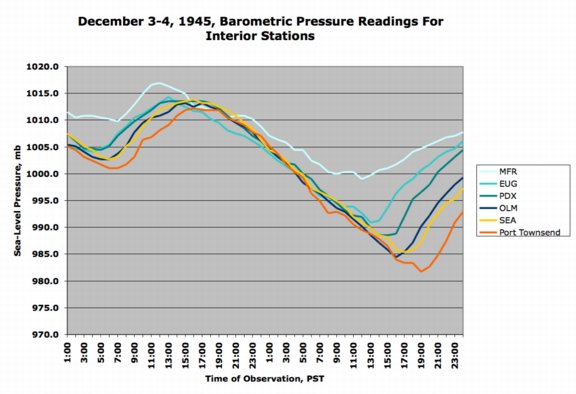
Table 2, below, lists the maximum gradients for some approximately standard measures during the December 4, 1945 cyclone. Point Arena (PTA--my own designation) sits in for Arcata. Astoria/North Head, Port Orford (PrOR, again my own designation) very roughly sits in for North Bend and Port Townsend (0S9--blame the FAA) is the closest available station to Bellingham during this time period. Pressure data for Arcata is available, but it appears to be low compared to surrounding stations. The coastal gradients in this storm were quite strong, approaching values achieved by the Big Three. Inland, the numbers are fairly high, but not quite at the levels of the Big Three. The EUG-PDX gradient for the Big Three, for instance, ranged from +9.1 to +9.6 mb (+0.27" and +0.28"). The MFR-EUG gradient for the Columbus Day storm was a spectacular +17.0 mb (+0.50"). Source: Hourly data are from the National Climatic Data Center, unedited surface observation forms. |
Table 2 Notes: [1] Last of two observations in a row with the same reading. [2] Last of two observations in a row with the same reading. |
Pressure Tendencies The December 4, 1945 windstorm brought with it a decent "pressure couplet" over much of Western Oregon and Washington. Strong pressure changes (+3.0 mb and higher) occurred from about Portland northward. Table 3, below, shows the maximum hourly changes in pressure for seven key stations in the Pacific Northwest. The +7.2 mb (+0.21") hourly surge at Tatoosh Island is among the highest for that particular station, though it is shy of the December 21, 1940 windstorm, which produced a +8.5 mb (+0.25") surge. Not even the Columbus Day storm, with a decidedly strong +6.2 mb (+0.18") surge, matched the December 4, 1945 storm. More on pressure tendencies in the peak wind/gust section below. Source: Microfilm copies of the unedited surface observation forms, obtained from the National Climatic Data Center. |
Table 3 Notes: [1] The 2.2 mb clmib at Port Orford is the last of two occurrences, the other having happened at 14:00. |
||||||||||||||||||||||||||||||||||||||||||||||||||||||||||||||||||||||||||||||||
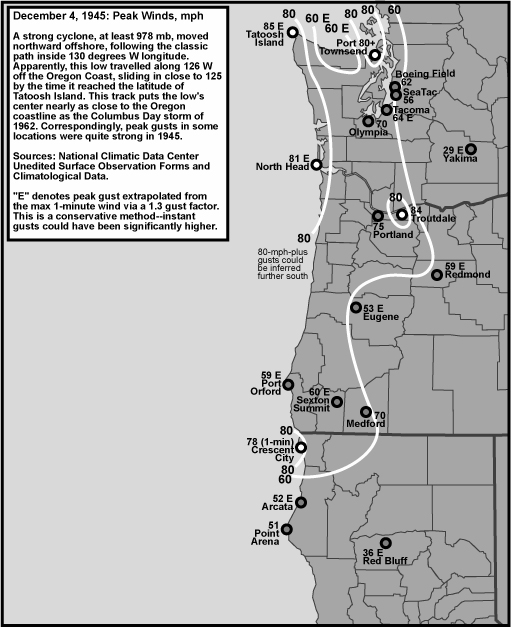
Table 4, below, lists the peak wind and gust for seven key stations in the Pacific Northwest, their direction, and their time of occurrence. "Peak Wind" is a 1-minute average, and "Peak Gust" is an instant reading. By my own personal methodology, a wind event rates the term "windstorm" when the average peak gust of eleven key stations reaches 39.0 mph (gale force) or higher. The December 4, 1945 windstorm surpassed this threshold, and rushed right into major windstorm category. Moderate windstorms have an average of 45.0 to 54.9, and major windstorms are those that reach or exceed 55.0. Only a handful of storms have made the majors, including December 21, 1940, December 12, 1995, November 14, 1981 and October 12, 1962. Due to missing stations, it's a bit of a stretch to compare the average values of this storm to those of later storms where the eleven stations are available. However, the maximum 1-minute winds for Portland and Olympia are quite spectacular. The peak gust for Port Townsend is low, as it is noted at "80+" on the surface observation form. Port Townsend sits in for Bellingham--judging from other windstorms, the velocity noted at Port Townsend is not unrealistic for Bellingham for a storm of this magnitude, though winds could have been lower at B'ham. No data is available for Astoria, and North Head reading used instead--an educated guess suggests that winds at North Head were likely higher than in the airport location of Astoria. Power interrupted at Olympia after the 55 G 70 mph reading at 15:44; estimated readings afterwards suggest the possibility that the peak gust could have been even higher. Gusts weren't always noted during this time period. Peak gusts in italics are extrapolated from the peak wind using a standard 1.3 gust factor, a conservative method. Actual gusts could have been higher (or lower). Taking the wind data at face value, it appears this storm may have been second only to the Columbus Day storm in wind magnitude. Indeed, the average of the 1-minute wind readings is higher than the average for the tempest of 1962; 49.7 mph vs. 52.0. With North Head in the data, the 1945 storm is a bit favored. Of interest is that the Columbus Day storm is still the grand-prize winner with average peak gust, by a large margin, 80.5 vs. 68.1. It appears that the storm of 1962 had very gusty winds. The powerful gale from the 1945 storm is even more interesting considering the relatively low pressure tendencies for this event. The Columbus day storm had the most extreme tendencies out of the "Big Four", with -4.6 and +6.2 mb 11-station-average peak 1-hour changes, the November 13-14, 1981 windstorm had -3.7 and +3.8, and December 12, 1995 had -3.5 and +4.5 mb average tendencies. With -2.5 and +3.2, the 1945 storm does not stand out--this from the #2 storm out of the four! Looks like major-strong pressure tendencies aren't required for a major-strong wind event. Interestingly, like the Columbus Day storm, the 1945 event produced relatively low readings at Sea-Tac. It appears that this type of storm does not favor extreme winds for the Seattle area--the Olympics may play a role in this phenomenon. There are other things about this storm that "feel" like the Columbus Day event, such as its (apparently) very close proximity to the coast, and the fact that it quickly followed a storm that raced up the coast the day before. This preceding storm had many characteristics similar to the October 11, 1962 Columbus Day storm predecessor, including possibly moving northward along the 130 W longitude line. Indeed, a vigorous predecessor may be a requirement for a Columbus-Day-like situation. What is being suggested here is that the December 4, 1945 cyclone may be the most Columbus-Day-like out of any other storm described on this website. However, the December 4, 1945 storm didn't move as quickly--peak winds and gusts happened between 04:30 and 21:25 between Arcata and Tatoosh Island--about 17 hours, which suggests an average northward speed of 30 mph for the storm system. Not too shabby, but . . . The Columbus Day storm completely "blows" this away, with just 10 hours between the Arcata peak gust, and the arrival of the west surge of winds at Tatoosh Island as the low center passed to the NNW--that's an average northward speed of 50 mph!!! This may be the primary explanation for the difference in peak wind gusts, and pressure tendencies between the two storms. Incidentally, the November 13-14, 1981 storm took 20 hours, which is an average of about 25 mph, and December 12, 1995 had about 15 hours separation in peak gusts between Arcata and Tatoosh, which is an average of about 33 mph. Source: Hourly data are from the National Climatic Data Center, unedited surface observation forms. |
| Location | Peak |
Direction |
Obs Time of |
Peak |
Direction |
Obs Time of |
| California: | ||||||
| Arcata | 40 |
SE |
04:30 HRS, 4th |
52 |
SE |
04:30 HRS, 4th |
| Oregon: | ||||||
| Prt Orford | 45 |
S |
14:00 HRS, 4th |
59 |
S |
14:00 HRS, 4th |
| Medford | 48 |
SSE |
06:48 HRS, 4th |
70 |
SSE |
06:48 HRS, 4th |
| Eugene | 41 |
S |
12:46 HRS, 4th |
53 |
S |
12:46 HRS, 4th |
| Portland | 57 |
SSW |
15:26 HRS, 4th |
75 |
S |
16:00 HRS, 4th |
| Washington: | ||||||
| N. Head [1] | 62 |
SW |
MM |
81 |
SW |
MM |
| Tatoosh I. | 66 |
SW |
21:25 HRS, 4th |
85 |
SW |
21:25 HRS, 4th |
| Olympia | 55 |
SSE |
15:44 HRS, 4th |
70 |
SSE |
15:44 HRS, 4th |
| Sea-Tac | 40 |
SSW |
19:27 HRS, 4th |
56 |
SSW |
18:58 HRS, 4th |
| Prt Townsend | 66 |
SSE |
18:10 HRS, 4th |
80 |
SSE |
18:10 HRS, 4th |
| AVERAGE | 52.0 |
S |
68.1 |
S |
Table 4 Notes: [1] North Head data from the Weather Bureau's Monthly Meteorological Summary, and time of occurrence is not available from this publication. |
Last Modified: April 16, 2004 You can reach Wolf via e-mail by clicking here. | Back | |