Avg/Max/Min Stats
Plot the mean/max/min, based on:
- Entire Period of Record
- Normal (1971-2000)
- Selected Years
- El Niño/La Niña/Neutral (combined, weak, moderate, strong)
Entire Period of Record - Selecting this option will calculate and plot the mean/max/min based on the entire station record
- Example when plotting "Multiple sites, single season".
- Example when plotting "Single site, multiple seasons".
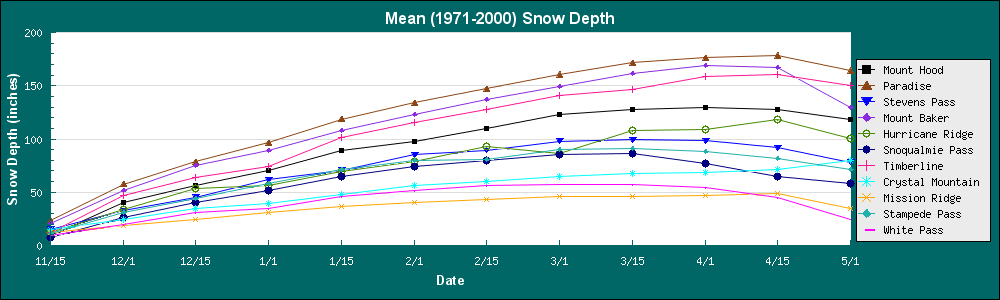
Normal (1971-2000) - Selecting this option will calculate and plot the mean/max/min based on the 1971 - 2000 average
- Example when plotting "Multiple sites, single season".
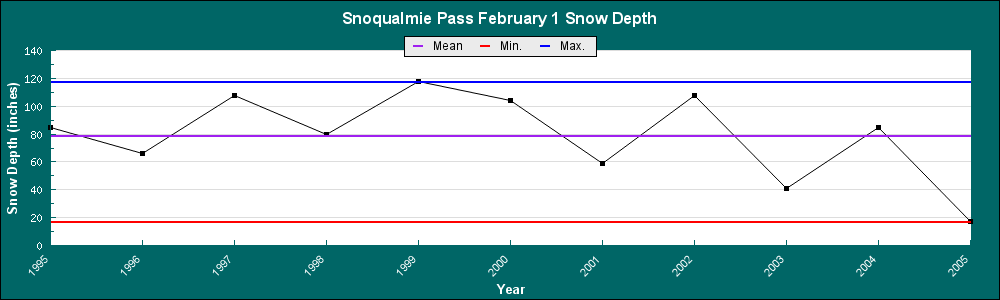
Selected Years - Selecting this option will calculate and plot the mean/max/min based on the years selected under "Period". Only available for plotting "Single site, multiple seasons", monthly data.
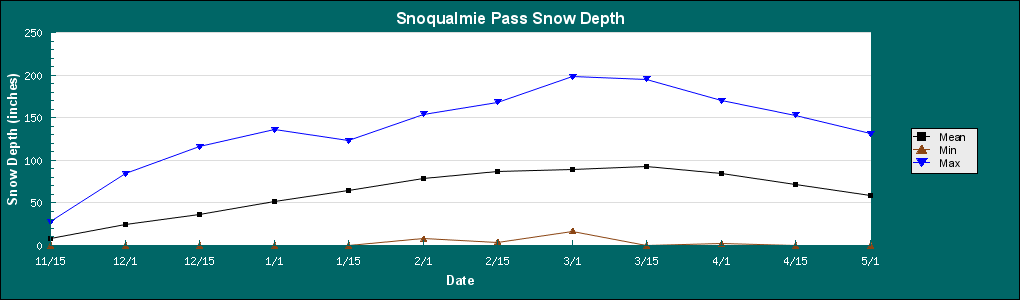
- Example Feb. 1, 1995 - 2005 snow depth at Snoqualmie Pass
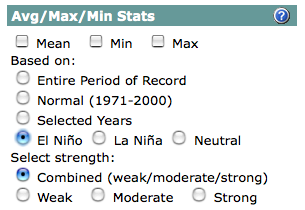
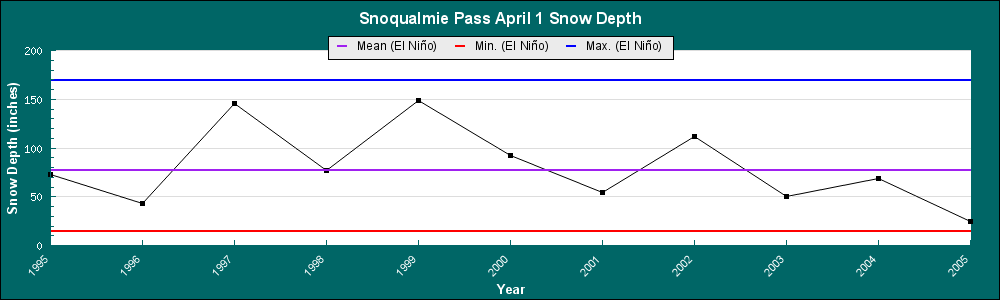
El Niño/La Niña/Neutral - Selecting these options will calculate and plot the mean/max/min based on the selected ENSO classification (El Niño, etc.) with the option of selecting weak, moderate, strong strength ENSO phases.
El Niño Southern Oscillation (ENSO) - warm (El Niño) and cold (La Niña) years are based on a +/- 0.5°C threshold of the November thru March average Niño 3.4 region (5°N-5°S, 120°-170°W) sea-surface temperature anomaly (based on the 1971-2000 base period). Neutral years are when the average Niño 3.4 anomaly is -0.5°C > 0 < 0.5°C.
Strength of ENSO
-
Weak: Between 0.5 and 0.9 °C
- Moderate: Between 1.0 and 1.4 °C
- Strong: Greater than 1.5°C
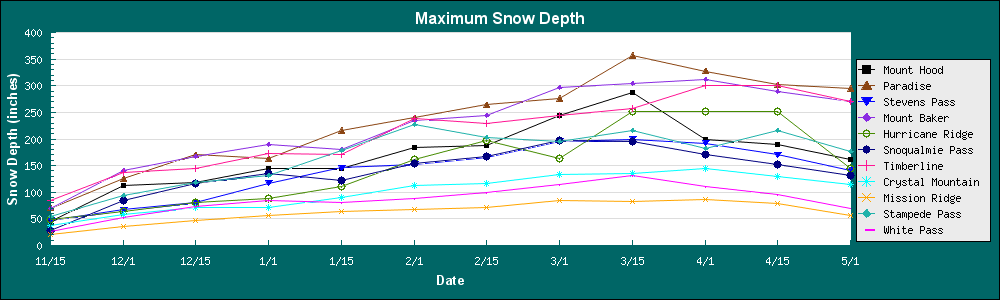
- Example of April 1, 1995-2005 snow depth for Snoqualmie Pass compared with the mean/max/min El Niño April 1 snow depths
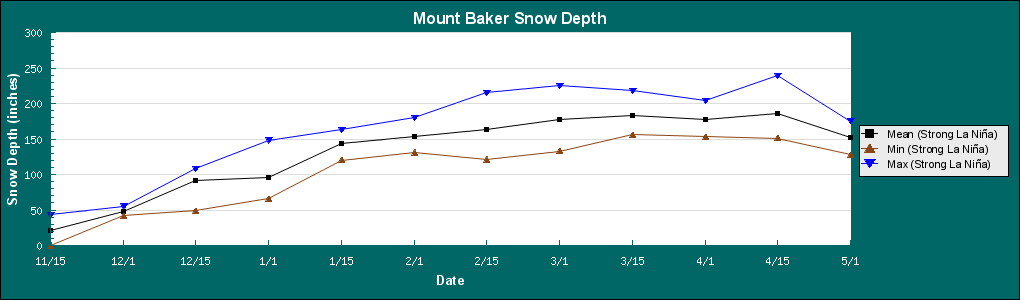
- Example of mean/max/min snow depth for Mount Baker during a strong La Niña