 |
|
Recent Precipitation near the Oso Landslide
3/25/2014 A landslide occurred on Saturday, March 22 east of Oso, WA in Snohomish County that resulted in a tragic loss of life. At least a contributing factor related to this landslide was the anomalously heavy rainfall that occurred at the location during February and March 2014. Precipitation data from several nearby weather stations are examined briefly here. Figure 1 shows a map of four weather stations considered here, as well as the approximate location of the slide (marked with an x). The "normal" time period for the Arlington and Darrington COOP sites is the 30-year period from 1981 through 2010. For the RAWS site on Gold Hill, the normal should be viewed with caution as there is only very limited data available. The normals were calculated using as little as 6 to 9 years for some months due to the incomplete nature of the data. For the Finney Creek RAWS, too little data were available to calculate normals, so only the 2013-14 precipitation data are presented here. 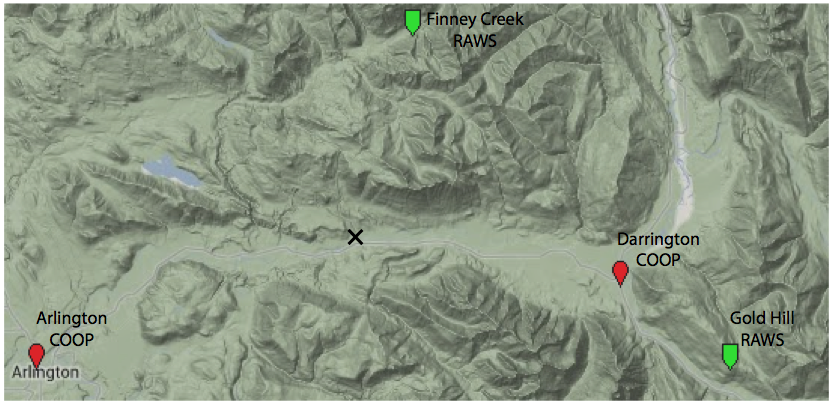
Figure 1: A map of the weather stations considered here, along with the approximate location of the landslide (the "x"). The stations are overlaid on a Google Map. Please click on the figure to see the full-size image. Table 1 shows the precipitation compared to normal for the four stations for several time periods: the beginning of the water year to the time of the landslide (Oct 1, 2013 to Mar 22, 2014), February, March 1 through March 22, and February 1 through March 22. The water year precipitation is very close to normal, but that number is deceiving. In reality, October through January was very dry. Beginning in the second week of February, the weather regime shifted, and western WA received much-needed "makeup rain". The rain was heavy and frequent enough to produce significantly higher than usual precipitation amounts for late winter. In February alone, Darrington received 130% of its normal precipitation. The Feb 1 through Mar 22 precipitation was near-to or double its usual amount in Arlington (176% of normal) and Darrington (205% of normal). And while the normal for Gold Hill should be viewed with a skeptical eye, the Feb 1 through Mar 22 precipitation was double the normal (based on 7 years) amounts there as well. Figure 2 shows the accumulated precipitation for Arlington and illustrates the seasonal progression of the precipitation very well. The wettest periods for the region of the landslide during the last three weeks appear to have been 2-6 March, and 15-19 March. This is a case of a landslide occurring after rather than during the heaviest rain. It is important to note that while February and March 2014 were certainly wetter than normal, the values do not appear to be unprecedented. In other words, there have been other months in which precipitation of comparable and even greater magnitude fell over the region. 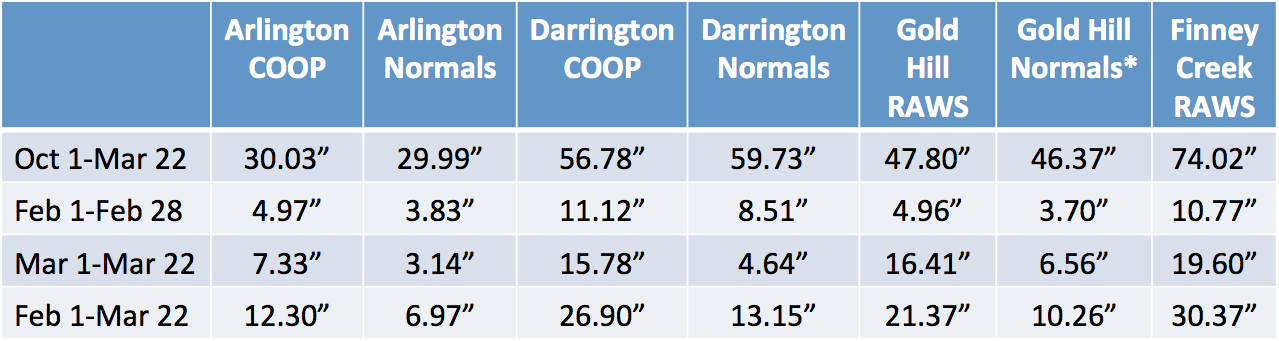
Table 1: The total precipitation (in inches) for several periods for the 4 stations shown in Figure 1. Normals are also shown for 3 of the stations. For Arlington and Darrington, the normals are based on 30-year averages (1981-2010). Gold Hill has incomplete data, and its normals for some months are based on as few as 6 to 9 years. Please click on the figure to see the full-size image. 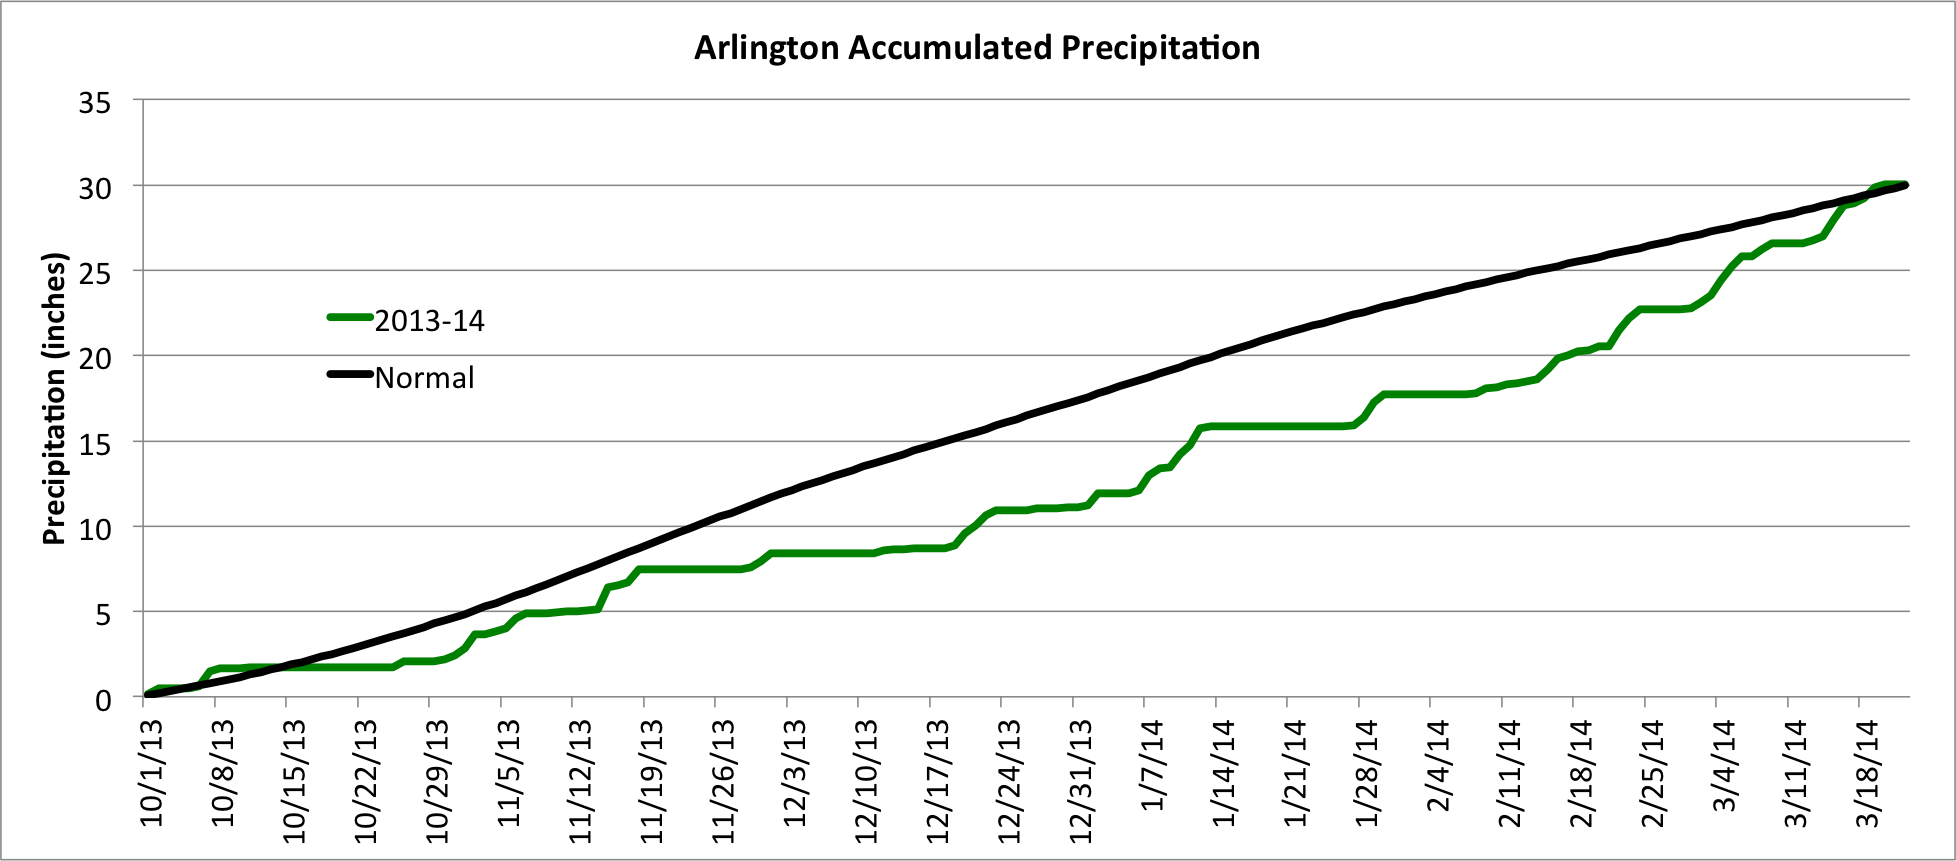
Figure 2: The accumulated precipitation for Arlington from October 1, 2013 through March 22, 2014 for 2013-14 (green line) and for the 1981-2010 normal (black line). Please click on the figure to see the full-size image.
|


 |