 |
|
A Review of Winter 2011-2012
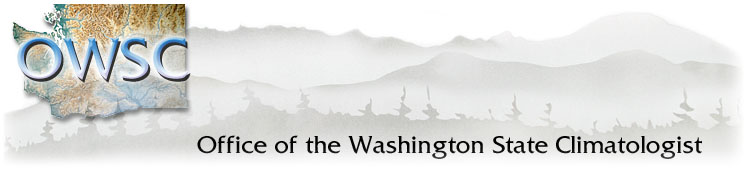
4/11/2012 La Niña conditions prevailed in the equatorial Pacific Ocean for the second winter in a row. Cooler and wetter than normal conditions in Washington State are typically associated with La Niña episodes - did this past winter fit those expectations? The strength of the La Niña event, average winter temperature and precipitation anomalies, and the snowpack conditions are summarized in this report. Figure 1 shows the sea surface temperature (SST) anomalies from 1992 through January 2012 in Niño 3.4 region of the equatorial Pacific Ocean. As seen in the figure, this winter's La Niña was weaker than the La Niña of 2010-11, typical for the 2nd year of La Niña doubleheaders (which are rather common). The Oceanic Niño Index (3-month running mean of SST anomalies in the Niño 3.4 region) reached about -1°C from September-October-November through December-January-February, indicating that the La Niña was a weak-to-moderate event. It is waning, and models are projecting a return to near neutral conditions by late spring/early summer. 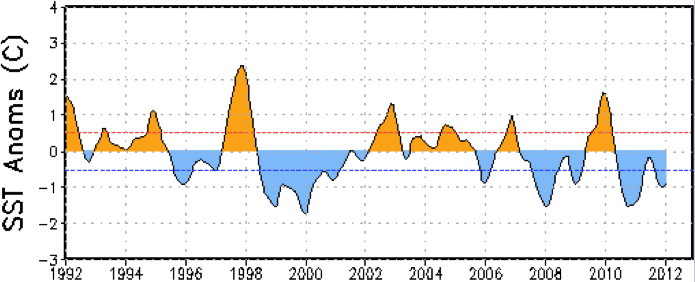
Figure 1: SST anomalies from 1992 through January 2012 in the Niño 3.4 Region of the tropical Pacific (from CPC). Please click on the figure to see the full-size image. How did the winter temperature and precipitation anomalies compare with those of past La Niña events? Figures 2 and 3 show the composite November through March temperature and precipitation anomalies for past La Niña events as defined by Bond and Harrison (2006) with the two most-recent La Niña events added in (2007-08 and 2010-11). Typically, temperatures are cooler than normal in the Pacific Northwest and wetter than normal, especially west of the Cascade Mountains in WA and OR. November through March temperatures this past winter were between 2 and 3°F cooler than normal in the Cascade Mountains and west, as well as for northeastern WA (Figure 4). The remainder of eastern WA, eastern OR, and inland into ID, however, had near-normal temperatures, which deviates from the composite La Niña conditions (note the different colorbars). The warm winter temperatures that extend from the Rockies to the eastern seaboard are hard to ignore in Figure 4. We note here that this was an unusually warm winter for the rest of the United States, which does not correspond to conditions during a typical La Niña, indicating that there were other factors. Precipitation in the Pacific Northwest did not fit with the typical La Niña pattern either, with parts of eastern WA, OR and ID receiving less precipitation than normal (Figure 5). The Central Basin and Okanogan Big Bend climate divisions in eastern WA received between 1 and 2 inches of precipitation less than normal while the rest of WA State received near-normal precipitation. The timing of the precipitation this past winter is also interesting: the October-December period was very dry statewide while the January-March period was rather wet for the state except for the central basin (not shown). 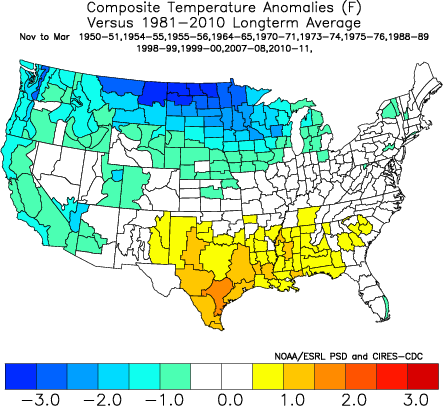
Figure 2: Composite Nov-Mar temperature anomalies (Fahrenheit) for the past La Niña events (from ESRL). 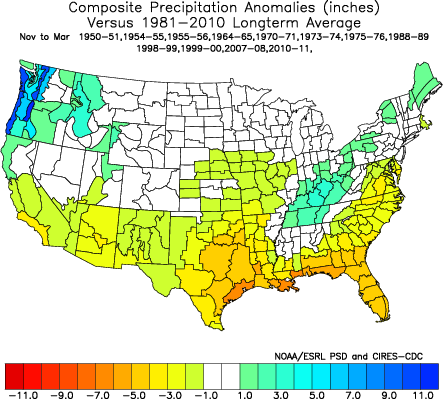
Figure 3: Composite Nov-Mar precipitation anomalies (inches) for the past La Niña events (from ESRL). 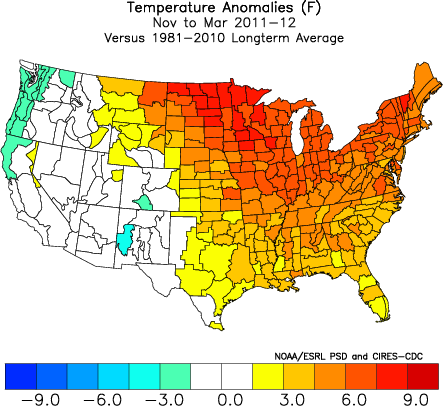
Figure 4: Nov-Mar temperature anomalies (Fahrenheit) from the 1981-2010 normal for the 2011-2012 winter (from ESRL). 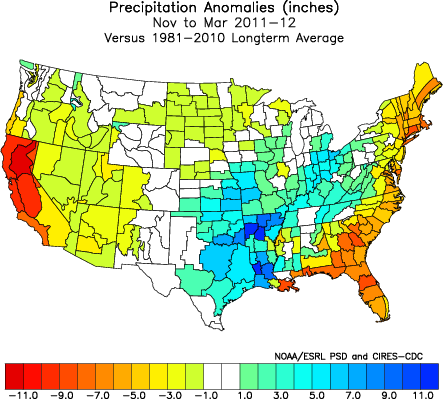
Figure 5: Nov-Mar precipitaion anomalies (inches) from the 1981-2010 normal for the 2011-2012 winter (from ESRL). The average 500 hPa geopotential height anomaly field for November through March is also shown, both for the composite La Niña events (Figure 6) and for this past winter (Figure 7). On average during La Niña, above normal 500 hPa heights extend from the central North Pacific into the Bering Sea and below normal heights occur over British Columbia (Figure 6). During this past winter the anomalously low 500 hPa heights were displaced to the northwest over Alaska (Figure 7). This produced flow anomalies that were more westerly than northwesterly off the Pacific into North America. The prevalence of air masses of Pacific rather than Canadian origin helped cause the surprisingly warm temperatures for the north-central US. The lack of positive precipitation anomalies for WA state is consistent with the near-normal 500 hPa heights for the winter of 2011-12, versus the lower than normal heights that usually occur during La Niña. 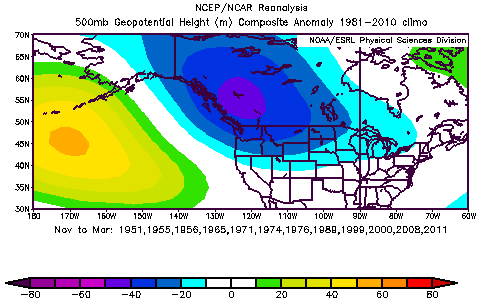
Figure 6: 500 hPa geopotential height anomalies from November through March for past La Niña events (from ESRL). 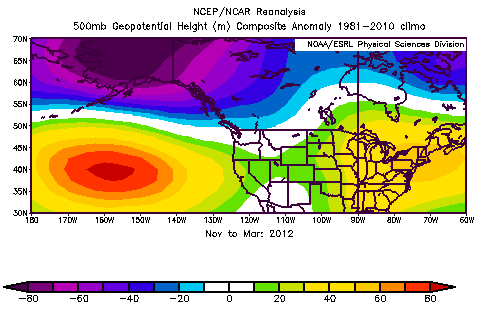
Figure 7: 500 hPa geopotential height anomalies from November 2011 through March 2012 (from ESRL). The average winter conditions provide one perspective on the past winter, but it is also worthwhile to consider the progression of the weather over the course of the season. The water year started out with near-normal temperatures and precipitation for most of the state in October. Colder than normal average temperatures prevailed in November with lower than normal precipitation, especially in central and eastern WA. Despite the dry conditions, several storms built up a respectable snowpack in the Olympics and the Cascades by Dec 1. This was not the case during the month of December, however, as very dry conditions statewide meant remarkably small contributions to the snowpack. December temperatures varied with cooler than normal temperatures west of the Cascades and in parts of eastern Washington and warmer than normal temperatures on the east slopes of the Cascades and areas beyond. Mean January temperatures remained cooler than normal for western WA and the northern tier of the state, and warmer than normal for southeast WA. Precipitation was greater than normal for most areas west of the Cascades and the Cascades themselves, with several mid-January storms resulting in the snowpack finally building. The east side of the Cascades remained mostly dry. Dry conditions continued through February for most of the state except for a few isolated locations throughout the state, where precipitation was above normal. Average February temperatures were near-normal statewide. Very large additions to the snowpack were made in March, as the cool, active weather pattern brought heavy snow to the mountains and produced cooler and wetter than normal conditions in the lower elevations as well. For additional details on the sub-seasonal variations of this past winter, please see the OWSC monthly newsletter. As mentioned above, snowpack lagged behind normal during mid-winter with the dry conditions in December, but rebounded to much above normal at the time of this writing. In fact, April 2 snow water equivalent (SWE), shown in Figure 8, is higher than at this time last year. However, there is no indication that heavy snow will persist into April this year, like what occurred in 2011. The National Weather Service Northwest River Forecast Center April through September water supply forecast projects normal (90-110% of normal) to greater than normal (110-150% of normal) streamflow for the entire state (Figure 9). 
Figure 8: Snowpack (in terms of snow water equivalent) percent of normal for WA as of April 2, 2012 (from NRCS). Please click on the figure to see the full-size image. 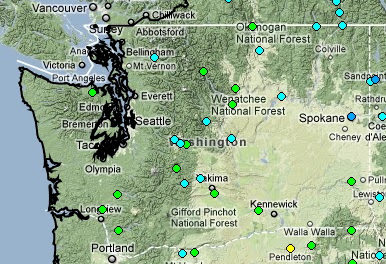 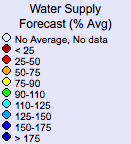 Figure 9: April through September 2012 water supply forecast for WA as of April 9, 2012 from the National Weather Service River Forecast Center. In summary, the fall forecast for a relatively cool winter was accurate for most of WA State, while the central basin and southeastern WA had near-normal temperatures (within 0.5°F of normal). Precipitation was either below normal or near-normal throughout WA, which is at some odds with what typically occurs during a La Niña. On the other hand, it is not unprecedented, and serves as a useful reminder that ENSO does not absolutely dictate atmospheric circulation patterns, which are also influenced by other modes of variability such as the Arctic Oscillation, which happened to be in the positive phase for the winter as a whole. Nevertheless, ENSO is the best predictor of seasonal weather for many parts of the globe, including the Pacific Northwest. In particular, it is quite reliable towards anticipating our snowpack at the end of winter, with 2011-12 running true to form. We will continue to monitor the state of ENSO and its predictions; by the middle of summer we should have a good idea of how it is liable to impact our weather during the upcoming fall and winter. ReferenceBond, N.A., and D.E. Harrison (2006): ENSO's effect on Alaska during opposite phases of the Arctic Oscillation. International Journal of Climatology, 26, doi: 10.1002/joc.1339.
|


 |