 |
|
January 2009 Flooding
1/12/2009 The extreme flooding that occurred in Washington in early January had two main contributors: heavy precipitation that fell on Jan 6th and 7th and warm temperatures that melted snow still on the ground in some places from the December storms. Streamflow in both western and eastern Washington was high (Figure 1), with many rivers reaching well above flood stage. Figure 2 shows the January 8th status of rivers in western Washington, and Figure 3 is a detailed view of one example (Newaukum Creek) of a river that was above flood stage. Near-record crests were observed at many rivers, and one record crest was even broken with this event: Snoqualmie River near Carnation crested at 62.31 ft (previous record 61.17 ft in 2006). Heavy precipitation on January 6th and 7th due to the warm, moist air mass that was moving into the state contributed to the overflowing rivers. Precipitation totals were high, but not unprecedented (Table 1) and the warm temperatures that accompanied the rain and melted snow in some areas were what helped make this a significant flooding event. Rain totals from CoCoRAHS (Figure 4) in King county for January 7th range from about 1.50-2 inches in western King, and 3-5 inches in eastern King county. The highest January 7th precipitation totals from CoCoRAHS occurred in Mason, Grays Harbor, and Thurston counties from about 3.38-5.62 inches. Some daily rainfall records were broken (but not all-time) on January 7th at airports: Sea-Tac saw 2.29 inches that broke 1.33 inches on January 7th in 1996, Olympia saw 4.82 inches breaking 1.95 set on January 7, 2002, and Quillayute saw 2.88 inches breaking 2.39 set on January 7, 1983 (from NWS). From the preliminary rainfall amounts, this rain event does not look to qualify as a 100-year event or even a 50-year event (see Figure 5 for 24-hour precipitation totals to qualify as a 100-year event). For example, in Seattle, a 100-year event is between 3.5 and 4 inches of rain in 24 hours which was not reached in this past storm. For Shelton, between 7 and 8 inches of rain must fall in 24 hours to be a 100-year event which also did not occur with the last storm. The terms are misleading and often misinterpreted so to clarify: a 100-year rain event means that there is a 1% chance that the amount of precipitation in that storm would be equaled or exceeded in a given year. A 50-year event means that there is a 2% chance that the amount of precipitation would be equaled or exceeded in a given year. This event was certainly significant, and had significant impacts (look for our newsletter in early February for more details), but the preliminary rainfall data at stations with long records shows that the rainfall was not unprecedented, despite the fact that the streamflow was record-breaking or near record-breaking. 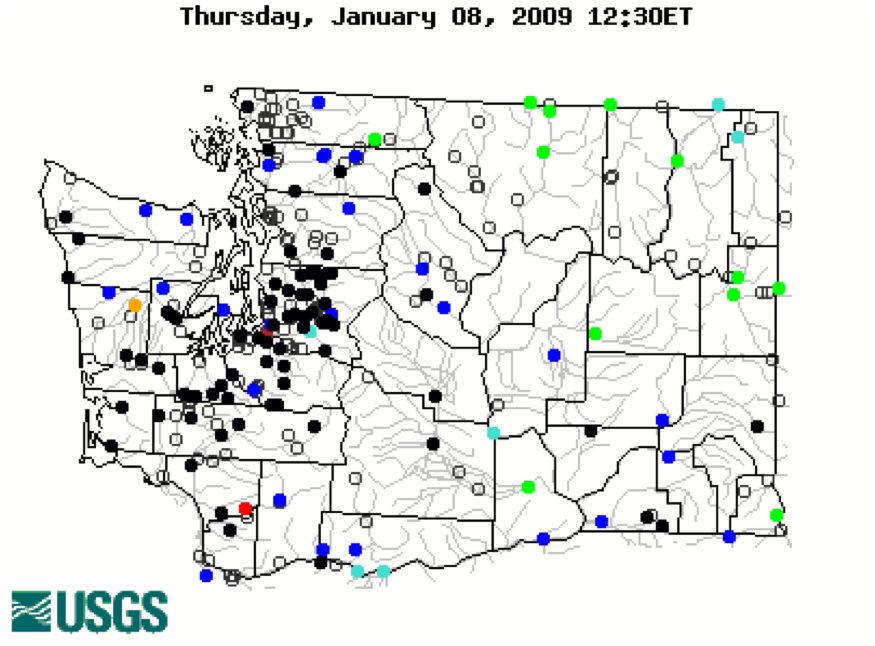
Figure 1: Streamflow data on January 8, 2009 compared to the normal streamflow for this date. Black dots are classified as High, dark blue are greater than 90% (much above normal), light blue is between 76-90% (above normal), green is between 25-75% (normal), orange is between 10-24% (below normal), and red is less than 10% (much below normal) [from USGS]. 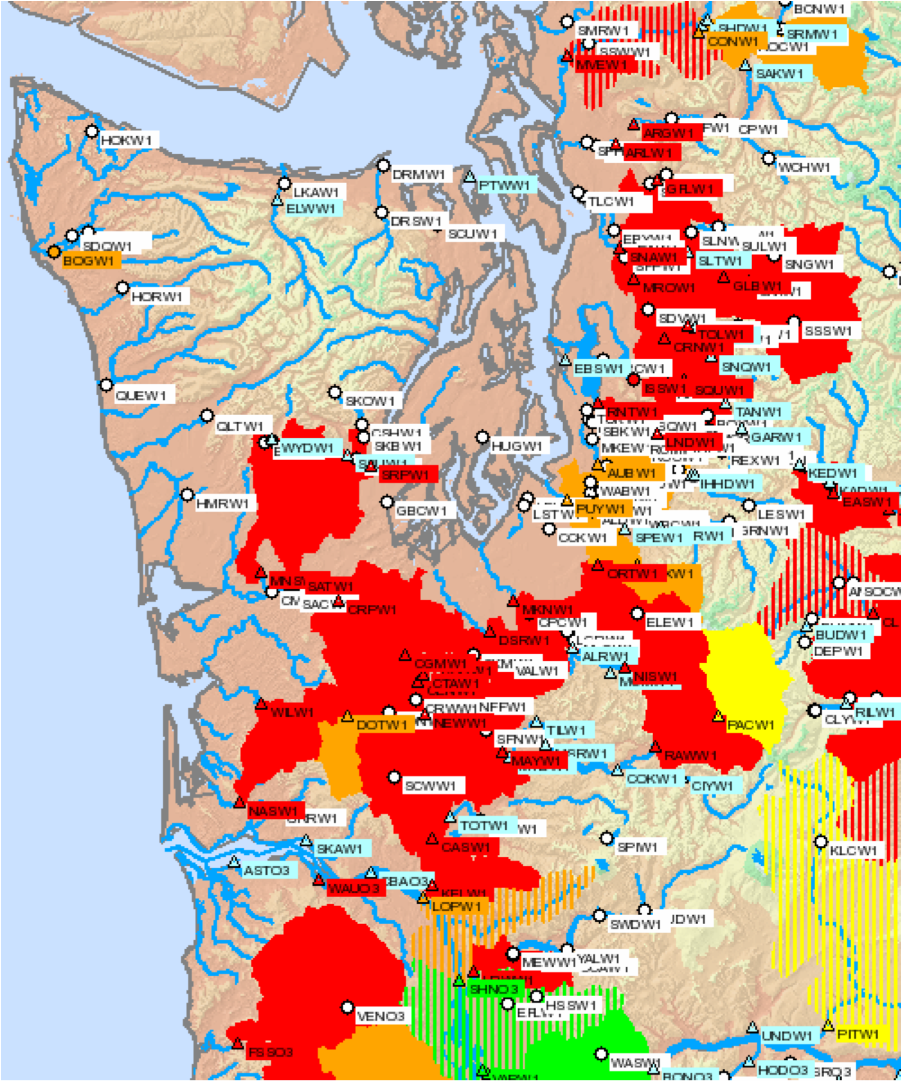
Figure 2: Snapshot of streams in western WA on January 8th with their flood status color-coded. Red is above the flood stage, orange is above bankfull, yellow is 90% of bankfull, and green is 80% of bankfull [from NWS]. 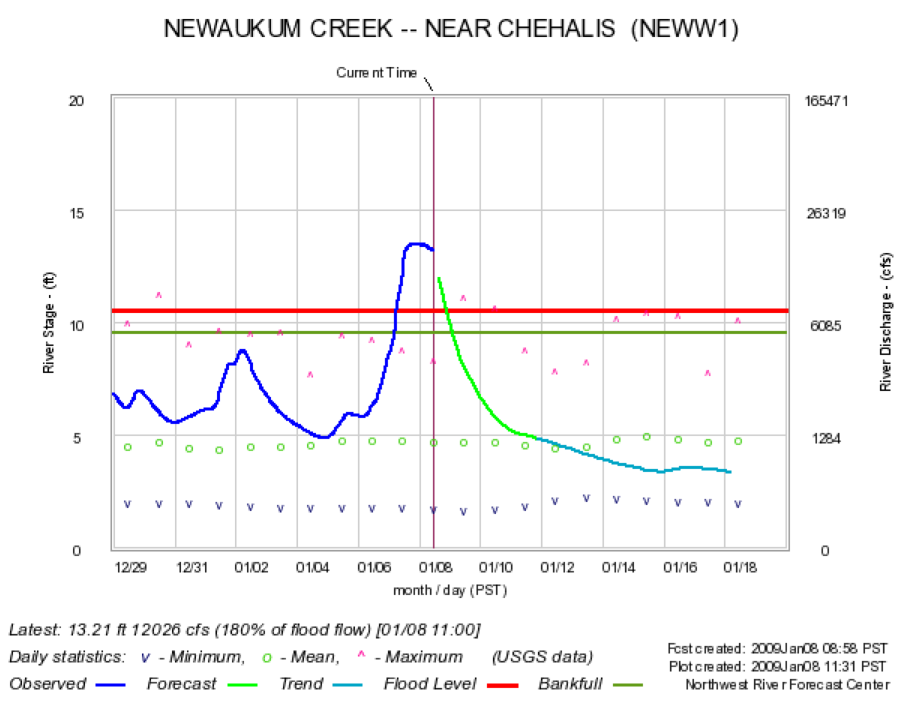
Figure 3: An example of a creek above flood stage (Newaukum) with its forecast plotted in green [from NWS]. 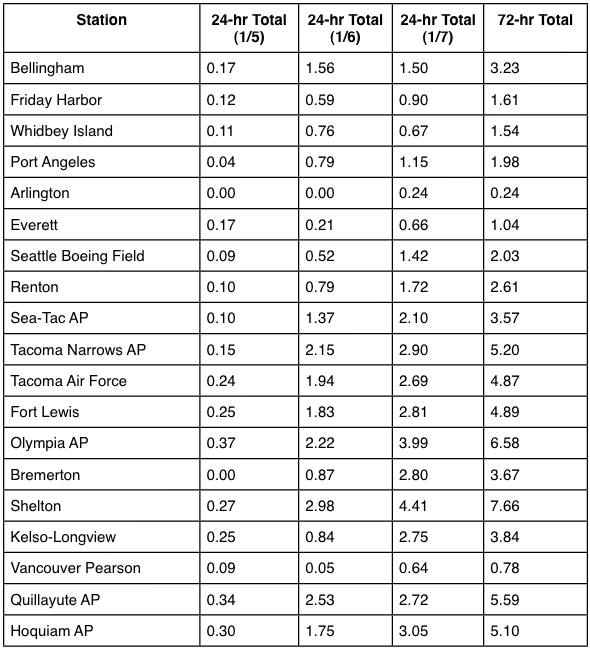
Table 1: 24 hour total precipitation (in inches) on 1/5, 1/6, and 1/7. The 24-hr is from 12Z meaning that the observations are from 4 am 1/6 through 4 am 1/7 (Jan 6 total) etc. 
Figure 4: Color-coded 24-hour precipitation ending at 7 am on January 8th from the CoCoRAHS network around the state. 
Figure 5: Map of 24-hour precipitation totals that would qualify as a 100-year event [from MGS Engineering Consultants].
|


 |