 |
|
Drought-like Conditions in Washington
7/5/2009 June has been remarkably dry in western WA (see Table 1), and the record for dry consecutive days in May and June was tied at Seattle-Tacoma International Airport (SeaTac AP) with 29 days this year from May 20-June 17. The dry spell started on May 20, and the period from May 20 through July 4 (46 days) of this year has been the driest recorded at SeaTac with 0.18 inches (next driest was 0.64 inches in 1965), the driest at Quillayute with 1.24 inches (next driest was 1.61 inches in 1972), the driest at Olympia with 0.23 inches (next driest was 0.40 inches in 1965), and the driest at Hoquiam Bowerman Airport with 0.40 inches (next driest was 0.78 inches in 1965). Looking at June total precipitation offers another measure for this year's dryness. SeaTac AP's June precipitation total was 0.18 inches, and a lower June precipitation total hasn't been measured at SeaTac since June 1987 in which 0.16 inches was recorded. Even in 2003 (a year where western WA experienced record low summer river flows), SeaTac AP's June total precipitation was higher than this year, with 0.51 inches. Hoquiam Bowerman Airport hasn't had a lower June precipitation total than 2009 (0.33 in) since it began records in 1953. Eastern WA had its dry spots as well, but Spokane, typically drier than Seattle in June, was actually wetter, receiving 100% of its normal precipitation. The concern comes from a study done by OWSC researchers that highlights how important summer precipitation is for most of the western WA river flows rather than stored snowpack. After all, it was the low precipitation in the summer of 2003 that caused record or near-record low streamflows in western WA despite the fact that snowpack was near-normal that year. OWSC is especially concerned about the northern Cascades and Olympics mountains because those areas were already dealing with lower than normal snowpack before this dry spell. Below normal precipitation in the northern Cascades and Olympic mountains this winter led to below normal snowpack, and the consequences are being felt this summer. While a drought hasn't officially been declared by the governor, low river flows throughout the affected regions are expected through September. Snowpack built slowly this winter, and after a very dry February, snow water equivalent (SWE) in the northern Cascades was only between 60-65% of normal in early March. The Olympics at that point were also feeling the impacts of below normal precipitation, with SWE at 51% of normal at that time. March was cold and snowy throughout Washington, however, and snowpack built significantly in the southern Cascades to above normal amounts, but ranged between 67-77% of normal in northern Cascades and Olympics as of April 1. Surprisingly, snowpack continued to build through April, and as of the beginning of May most of the basins in WA had normal or above normal snowpack except for the North Puget Sound, Upper Columbia, Central Columbia, and Olympic Basins (Figure 1 - from NRCS) which had SWE ranging between 70-81% of normal. A string of abnormally warm days in May melted some of the snowpack early so that by the beginning of June, the North Puget Sound Basin (the western flank of the northern Cascades) was only at 58% of normal SWE while the rest of the northern Cascades were at 76% of normal, and the Olympics were at 73%. Despite the snowpack making a late-season recovery, the impacts of below normal snowpack is causing low flows in snowmelt-dominated rivers. As of June 18 (Figure 2), the Northwest River Forecast Center was forecasting 50-75% of normal streamflow for the Okanogan River near Tonasket, Similkameen River near Nighthawk, and Methow River near Pateros through September 1. Other rivers in the areas of concern (i.e. Dungeness near Sequim and Skagit near Concrete) are forecasted to have flows that are 75-90% of normal through September. These lower than average flows have impacted junior water users in these areas. Junior water users have been told to contact the River Flow Irrigation Line at the Department of Ecology before irrigation water can be diverted. As of June 29, the Okanogan and Similkameen Rivers were above their minimum flows, therefore allowing water to be diverted, but the Methow River was below minimum flow (actual: 1,790 cfs; minimum: 2,156 cfs) so water was not able to be withdrawn. 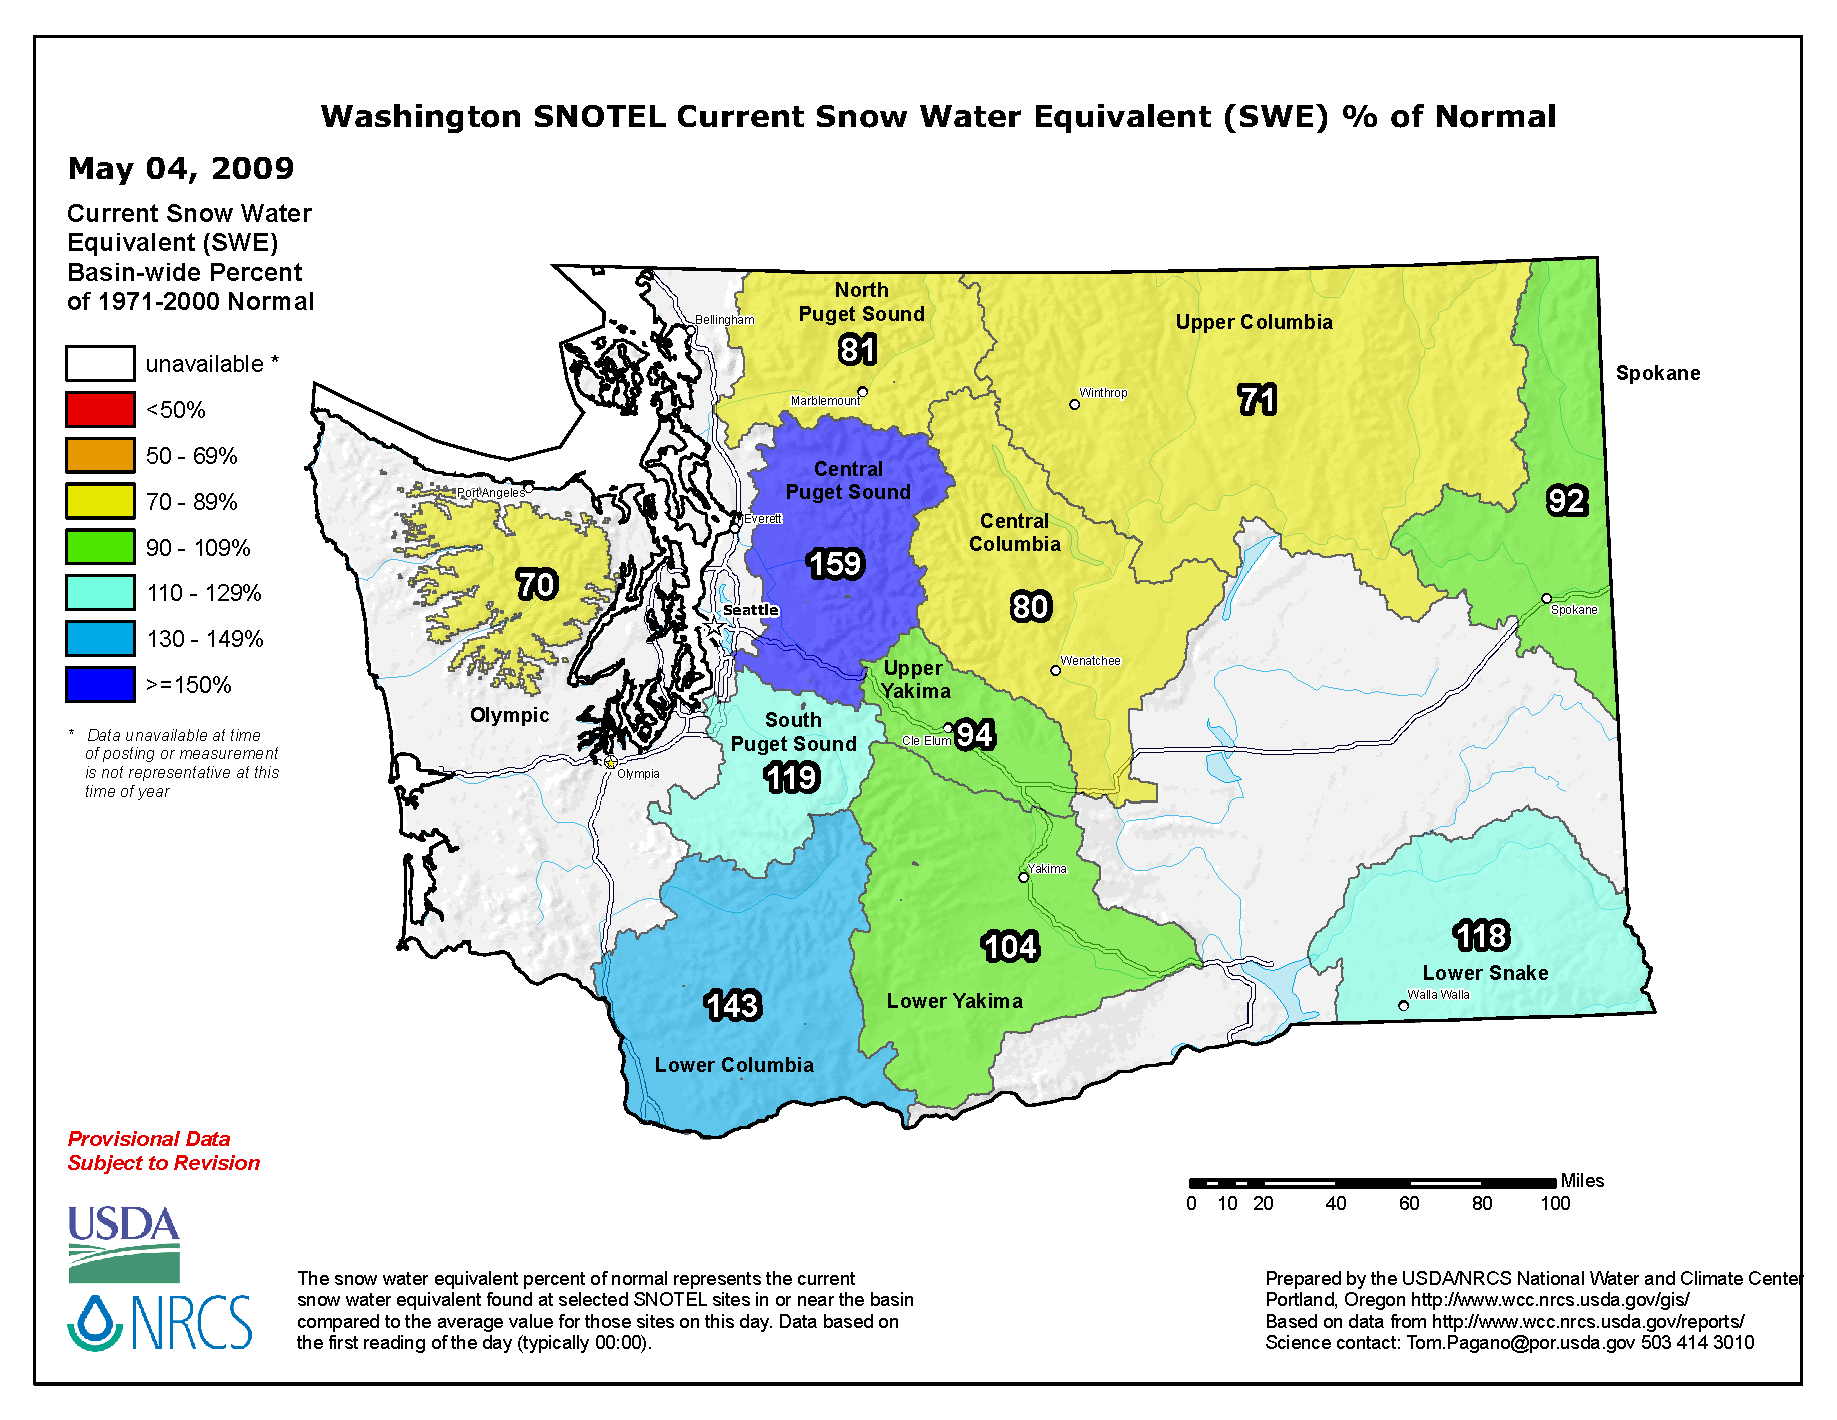
Figure 1: Basin-averaged snow water equivalent (SWE) percent of normal from the National Resources Conservation Service (NRCS) as of May 4, 2009 (http://www.wcc.nrcs.usda.gov/gos/snow.html). [Please click on this image to view it larger]. 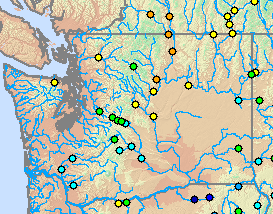
Figure 2: June 18 predicted streamflow for June through September from the National Weather Service Northwest River Forecast Center (http://www.nwrfc.noaa.gov/water_supply/ws_fcst.cgi). 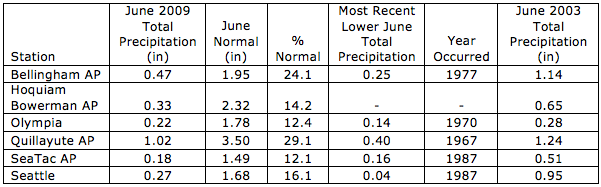
Table 1: June total precipitation (in) for select western WA locations, the normal June precipitation, and the percent of 1971-2000 normal. Also shown is the most recent June precipitation total that is lower than the 2009 total and the year that it occurred as well as the 2003 June precipitation total for comparison.
|


 |